


Gold prices in Australia are losing the shine amidst appreciated domestic currency. The dollar prices are dipping in the international market, providing support to the cross-currency pair of AUD-USD, which in a cascade is exerting pressure on gold prices in Australia.
The prices of XAU-AUD fell from the level of A$1880.99 (Dayâs high on 15th May 2019) to the present level of A$1841.67 (as on 30th May 2019 AEST 7:54 PM), as the dollar index retraced from the top level of around 98.37 twice.
The drop in US Â dollar supported the Australian dollar prices, and the AUD recovered from the level of US$0.6863 (dayâs low on 17th May 2019) to the present level of US$0.6933 (as on 30th May 2019 AEST 7:56 PM).
Comparative Analysis:
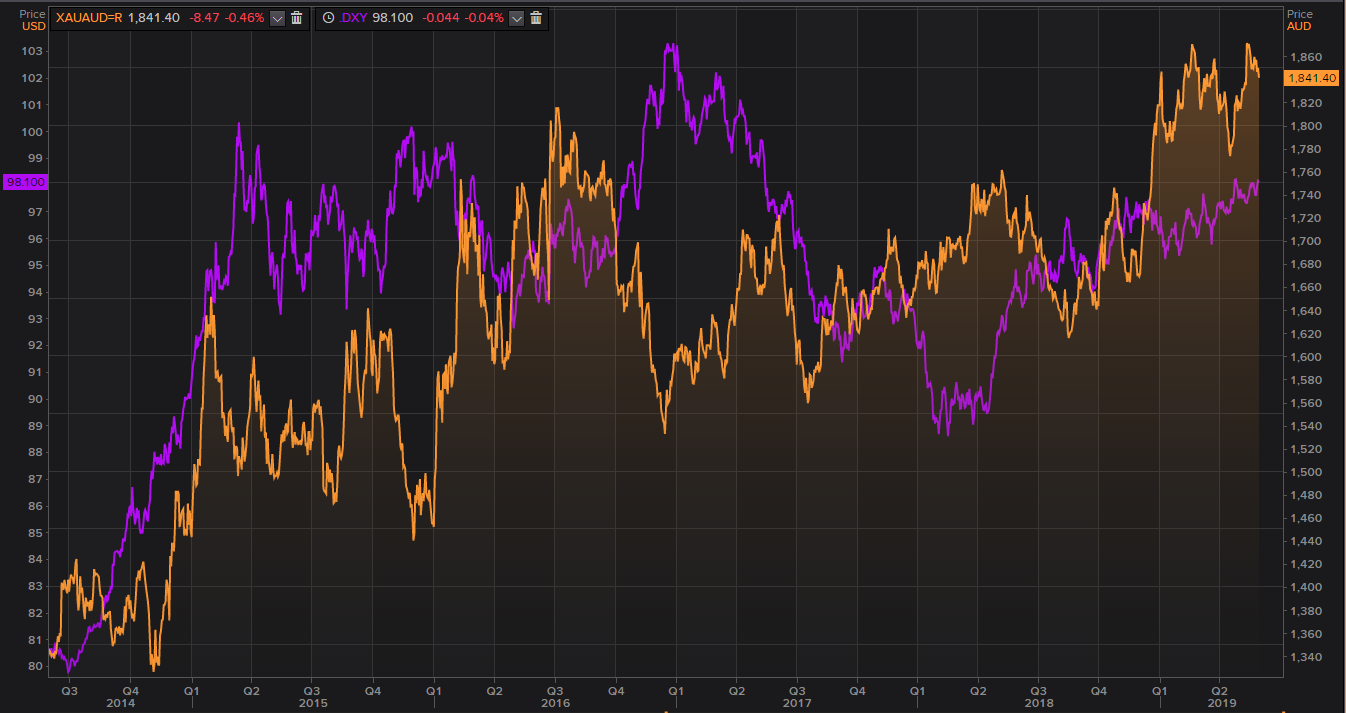 DXY and XAUAUD Comparative Chart
As it can be seen from the above chart, the dollar prices and XAU-AUD (Australian Gold) establishes a positive correlation; thus, a drop-in dollar prices exert pressure on the Australian gold prices, as it appreciated the domestic currency of Australia (AUD).
Technical outlook:
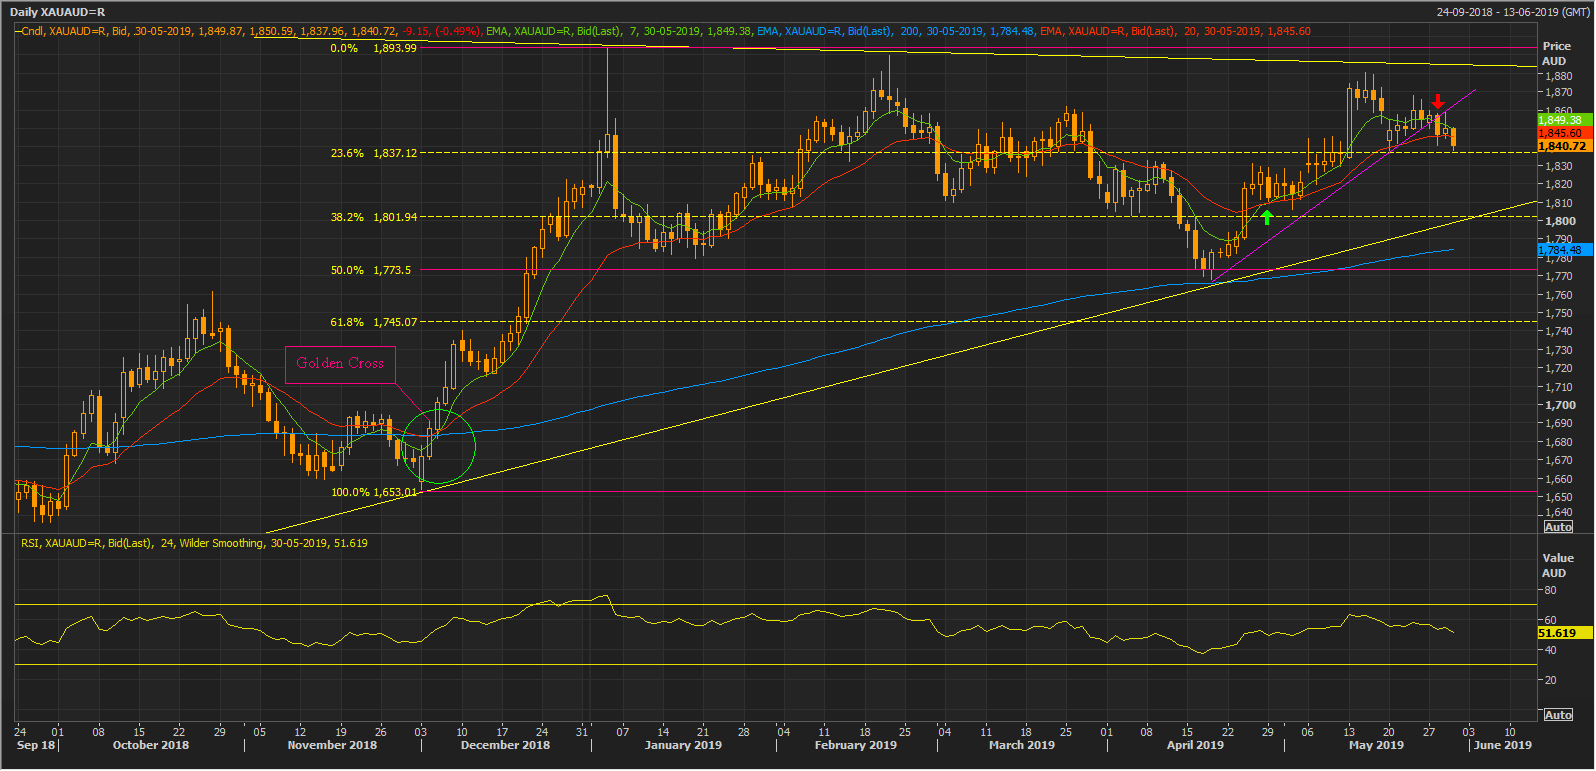 XAU-AUD Daily Chart (Source: Thomson Reuters)
A daily chart of XAU-AUD revels that the gold prices moved in a continuous uptrend from the level of approx. A$1653.01 to the level of A$1893.99.  The prices rose after a long-term Golden Cross-over (bullish signal) emerged on a daily chart. The short-term pair of 7-days and 20-days exponential moving average crossed the long-term 200-days exponential moving average line from below. Hence, establishing a golden cross, which in turn supported the prices and the gold prices rose to the level of approx. A$1894.00.
The initial up-rally from the level of A$1653.01 corrected slightly more than 50.0% till A$1768.68 (dayâs low on 18th April 2019).
Post correcting by 50%, the gold prices moved in a short-term uptrend marked by the pink upward sloping trendline, with a short-term golden cross of 7 and 20-days exponential moving average, marked on the above-shown chart with a green upside arrow. However, in the recent event, the prices breached its short-term trend line and dropped as shown with a red downside arrow on the daily chart. The prices are currently hovering at A$1843.15 (as on 30th May 2019 AEST 8:45 PM).
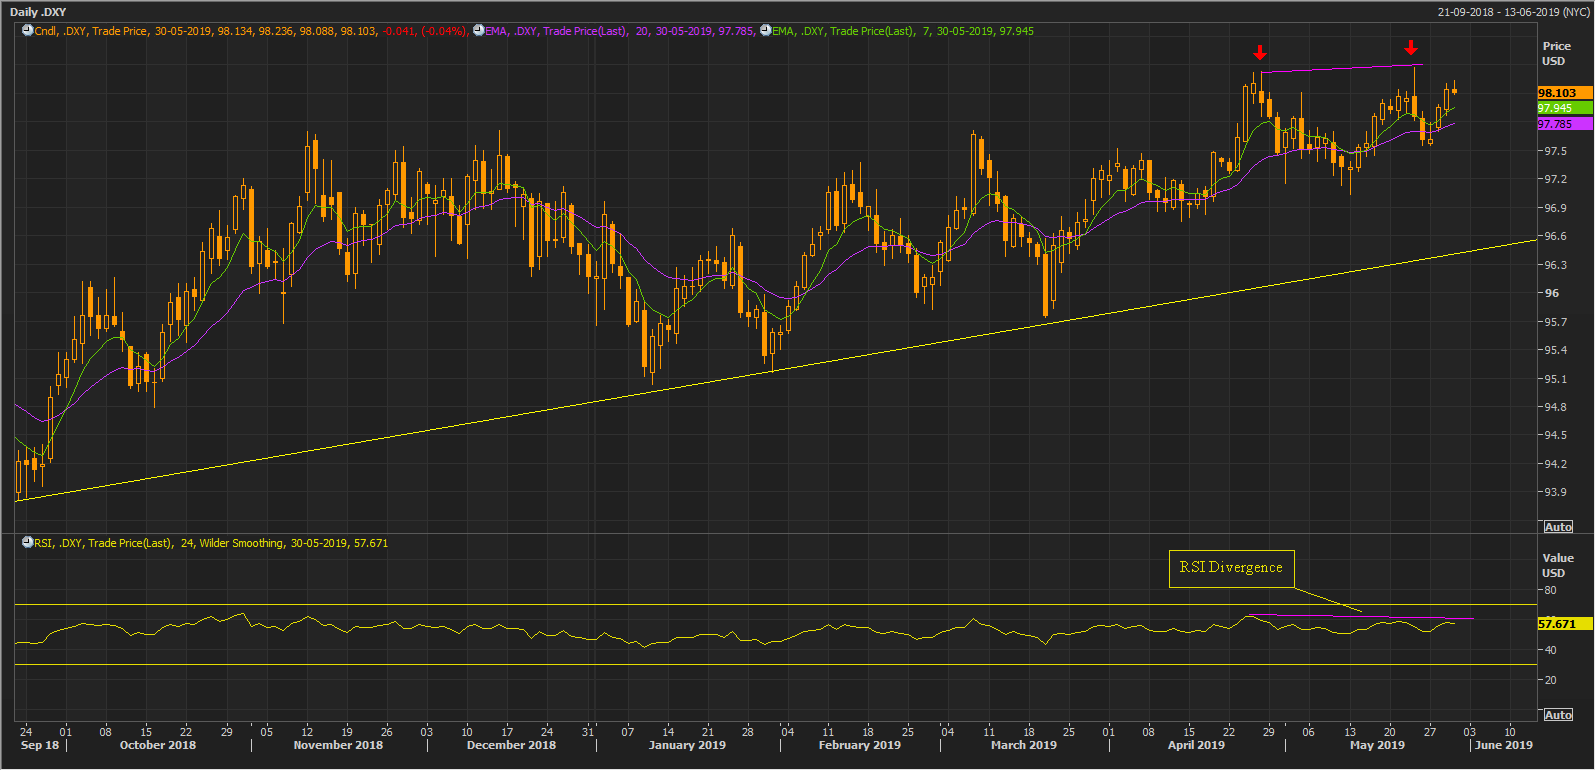 DXY Â Daily Chart (Source: Thomson Reuters)
On following the development on a daily chart, it can be seen that the dollar index moved in a continuous uptrend as shown with an upward sloping yellow trendline. However, the dollar index retracted twice from the level of 98.37, as shown with two red downward arrows.
The dollar prices are trading above its short-term 7-days exponential moving average which is at 97.945 and its medium-term 20-days exponential moving average which is at 97.785, however, the level of 98.37 is providing a substantial hurdle to the index.
A breach above the hurdle or failure to do so would decide the further direction of the index. On the indication site, the 14-days Relative Strength Index is showing a divergence as the prices have breached the previous top high, but the RSI failed to do so, which in turn, could further offer strong hurdle to the prices.
Disclaimer
This website is a service of Kalkine Media Pty. Ltd. A.C.N. 629 651 672. The website has been prepared for informational purposes only and is not intended to be used as a complete source of information on any particular company. Kalkine Media does not in any way endorse or recommend individuals, products or services that may be discussed on this site. Our publications are NOT a solicitation or recommendation to buy, sell or hold. We are neither licensed nor qualified to provide investment advice.
