Summary
- Lordstown Motors Corp (Nasdaq:RIDE) reported a net loss of US$125 million in Q1, 2021.
- Fisker Inc (NYSE:FSR) has a market cap of US$4.7 billion.
- NIO Inc.’s (NYSE:NIO) total revenue surged to US7.9 billion in Q1, 2021.
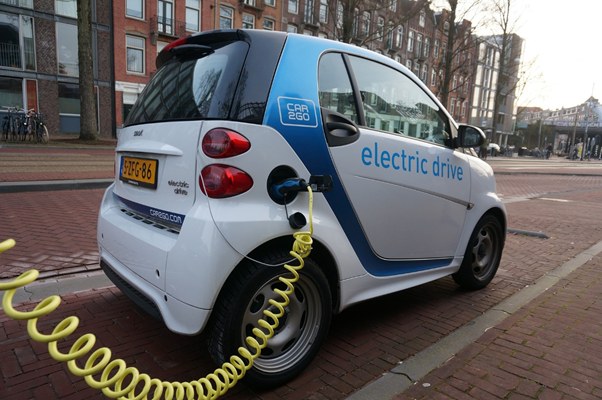
Electric vehicle stocks are companies that manufacture and sell EVs, including cars, trucks, and SUVs. These companies also provide parts, batteries, and services like charging stations required for electric vehicles.
As governments worldwide are committed to reducing vehicular emissions, they have begun to develop policies to promote renewable energy products, including vehicles. Thus, many auto companies have begun to shift to EVs.
As a result, many new companies have entered the market. The global EV market is likely to grow rapidly in the near future.

Source: Pixabay.
Lordstown Motors Corp (Nasdaq:RIDE)
This Ohio-based company produces electric vehicles like trucks. The stock of the RIDE traded at US$7.48 in the premarket session on July 26, down 8.67 percent from the previous close. The stock of RIDE declined 62.71 percent YTD.
RIDE's market capitalization is US$1.32 billion. The forward P/E one year is -3.22, and the beta is 5.29. The last 52 weeks highest and lowest stock prices are US$31.80 and US$6.69. The share volume is 7,137,717. In Q1 of 2021, it reported a net loss of US$125 million and a cash reserve of US$587 million.

Source: Pixabay.
Fisker Inc (NYSE:FSR)
Fisker Inc designs and manufactures electric vehicles and provides mobility solutions. The company's flagship Fisker Ocean sport utility vehicle received a good response.
The stock value of FSR traded at US$15.89 at 8.58 am on July 26, down by 0.19 percent over the closing price of July 23. The stock price of FSR soared by 8.67 percent YTD. Its market capitalization is US$4.7 billion.
The earnings per share (EPS) of the FSR are US$-1.71. The last 52 weeks highest and lowest stock prices are US$31.96 and US$8.70. The share volume is 4,659,651.
The total revenue of the FSR for Q1, 2021 was US$20000, and gross profit was US$10000. The FSR incurred losses of US$174.84 million in this quarter.
NIO Inc (NYSE:NIO)
NIO Inc. manufactures autonomous EVs, equipped with next-generation technologies and artificial intelligence.
The stock of NIO traded at US$42.63 at 9.22 am ET on July 26, down by 3.11 percent over the closing price of July 23. The stock value of NIO fell by 9.75 percent YTD. The market capitalization of NIO is US$72 billion.
The forward P/E one year is -67.68, and the EPS are US$-0.94. The beta is 2.56. The highest and lowest stock price of NIO for the last 52 weeks is US$66.99 and US$10.91. The share volume is 49,559,126.
The total revenue of NIO in Q1, 2021, was US7.9 billion, and it was US$3.7 billion in Q1, 2020. Gross profit for Q1, 2021, was US$1.5 billion against a loss of US$167.5 million in Q1, 2020. NIO incurred losses of US$295.9 million in Q1.
Workhorse Group, Inc. (Nasdaq:WKHS)
Workhorse Group, Inc. designs and manufactures electric vehicles and aircraft.
The stock of WKHS traded at US$10.79 at premarket on July 26, down by 3.75 percent over the closing price of July 23. The stock value of WKHS fell by 45.45 percent YTD. The market capitalization of WKHS is US$1.3 billion.
The forward P/E one year is -6.87, and the EPS are US$-0.36. The beta is 2.7. The highest and lowest stock price of WKHS for the last 52 weeks is US$42.96 and US$7.07. The share volume is 4,985,064.
The total revenue of this US-based company for Q1, 2021, is US$520000. And in Q1, 2020, it was US$8000. Net loss for the quarter was US$120.51 million.
Arcimoto, Inc. (Nasdaq:FUV)
Arcimoto, Inc. designs, builds, and sells fun electric utility vehicles as well as two-wheelers and three-wheelers.
The stock of the FUV traded at US$15.50 at 9.36 am ET on July 26, down by 3.91 percent over the previous closing price. The stock value of FUV went down by 62.71 percent YTD.
FUV’s market capitalization is US$552 million. The forward P/E one year is -25.20, and the beta is 2.53. THE EPS are US$-0.62. The last 52 weeks highest and lowest stock prices of the FUV are US$36.80 and US$4.68. The share volume is 104,580.
Also read: XPeng Inc (XPEV) and NIO Inc (NIO): 2 trending Chinese EV stocks
The total revenue of the American EV maker for Q1, 2021 was US$1.39 million and US$620000 in Q1, 2020. Gross profit (losses) for Q1, 2021 was US$1.85 million and US$1.87 million YoY. Operating losses were US$7.68 million and US$3.36 million in Q1, 2021 and Q1, 2020, respectively.
Electra Meccanica Vehicles Corp. Ltd. (Nasdaq:SOLO)
Electra Meccanica Vehicles Corp. Ltd, the automobile company, develops and sells EVs. The stock of SOLO traded at US$3.58 at 10.05 am on July 26, up by 2.29 percent over the closing price of July 23. The stock price of SOLO was down by 42.06 percent YTD. Its market capitalization is US$229 million.
The forward P/E one year is -10.61. The earnings per share (EPS) of the SOLO are US$-1. The last 52 weeks highest and lowest stock prices are US$13.60 and US$2.34. The share volume is 230,348.
The total revenue of SOLO for Q1, 2021 was US$180000 and Q1, 2020, was US$9000. Gross profit (losses) for Q1 this year was US$3000 and in Q1, 2020, was US$4000. Operating losses of SOLO this quarter were US$8.91 million.
Please note: The above constitutes a preliminary view, and any interest in stocks/cryptocurrencies should be evaluated further from an investment point of view.


