


Hardide PLC (LON:HDD)
United Kingdom-based company, Hardide plc is a provider of tungsten carbide coatings which are used in critical metal component applications in abrasive, erosive, corrosive and chemically aggressive environments. The company has segregated its operations into three divisions, namely, UK operation, US operation and Corporate. The company offers wear and corrosion resistant nanostructured and low temperature CVD (chemical vapor deposition) coatings, which can be applied in metal, steel and alloys as well. The companyâs products cater to different sectors, which include oil & gas, aerospace engineering, power generation and precision technologies.
HDD-Financial results for the year ended 30th September 2019
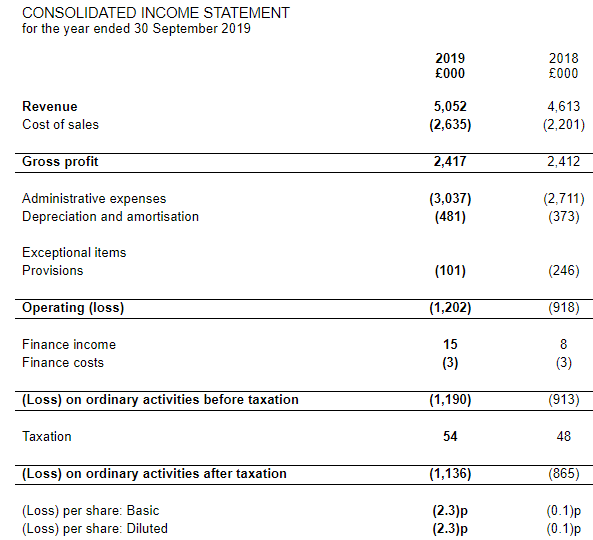
(Source: London Stock Exchange)
The company generated record sales of £5.1 million in the fiscal year ended 30 September 2019 as against £4.6 million in the fiscal year 2018. Production salaries resulted in direct expenses to rise by 20 per cent as a result of higher volume and sales mix coupled with rise in staffing and production activity. The companyâs gross profit stood at £2.4 million this year, which was flat in comparison to the previous year.
The company's EBITDA loss excluding exceptional items was £0.6 million for the fiscal year 2019. The companyâs grant income was recorded at £0.1 million during the year. The companyâs net assets were valued at £7.7 million on 30th September 2019 on the balance sheet as against £5.1 million on 30th September 2018. The company had cash balances of £4.8 million on 30th September 2019 as compared to £3.3 million on 30th September 2018.
HDD-Stock price performance
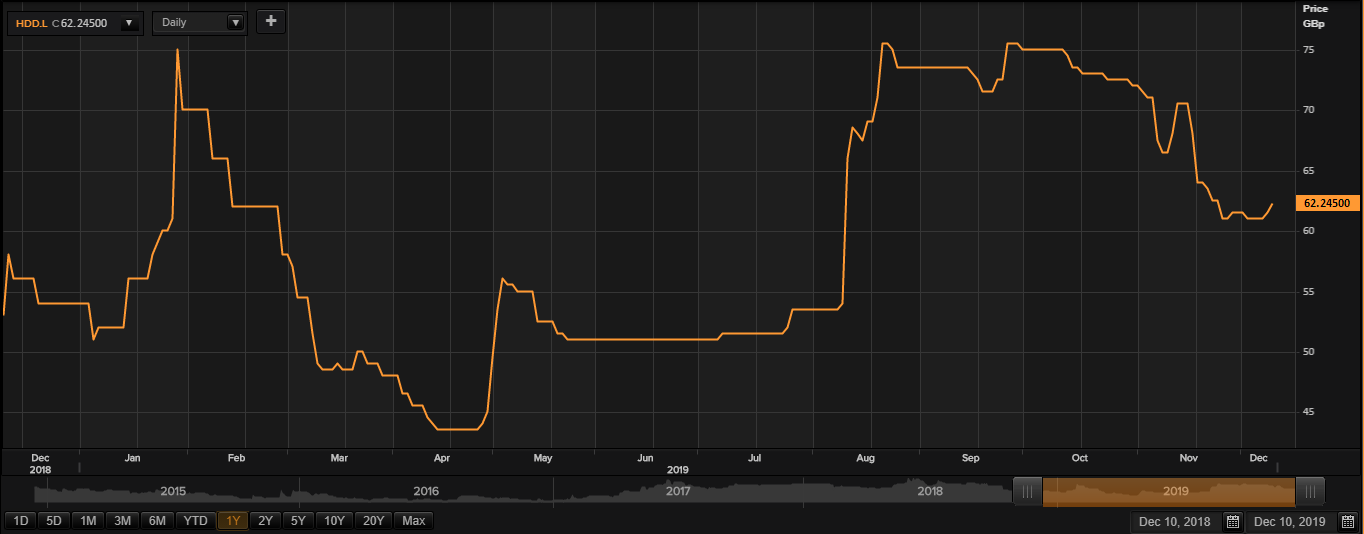
(Source: Thomson Reuters) Daily Chart as on Dec-10-19, before the market close
On 10th December 2019, while writing at 09:20 AM GMT, HDD shares were clocking a current market price of GBX 62.24 per share on the LSE. The companyâs market capitalisation was at £30.21 million at the time of writing.
On 30th January 2019, the shares of HDD have touched a new peak of GBX 78.00 and reached the lowest price level of GBX 42.00 on 12th April 2019 in the last 52 weeks. The companyâs shares were trading at 20.20 per cent lower from the 52-week high price mark and 48.19 per cent higher the 52-week low price mark at the current trading level as can be seen in the price chart.
The stockâs traded volume was hovering around 793 at the time of writing before the market close. The 5-day daily average traded volume of the stock was 20,526.20; 30 daysâ daily average traded volume- 21,849.23 - and 90-daysâ daily average traded volume â 19,049.44. The volatility of the companyâs stock was 72 per cent lower as compared with the index taken as the benchmark, as the beta of the companyâs stock was recorded at 0.28.
The shares of the company have delivered a negative return of 16.33 per cent in the last quarter. The companyâs stock surged by 13.89 per cent from start of the year to till date. The companyâs stock has given investors 7.52 per cent of negative return in the last month.Â
Â
Frenkel Topping Group PLC (LON:FEN)
United Kingdom-headquartered, Frenkel Topping Group PLC is a specialised asset manager and independent financial adviser, which regards itself as financial social worker and is focused predominantly on the recipients of clinical negligence and personal injury awards. The company provides financial service advice, recommendations and support to vulnerable clients, including pre- and post-settlement financial guidance to clients, and managing the financial and investment requirement of clients throughout the country.
FEN-Trading update for FY19
The specialist independent financial advisor and asset manager, Frenkel Topping Group released a trading update for the fiscal year 2019 period ended 31st December 2019. The company has shown decent performance driven by organic growth in businesses, which has led to rise in the assets under management despite of weakness in equities due to political uncertainty around, the company enjoyed high retention ratio of clients. The company expects the trading performance of the company to be in line with the management expectations which would be further subjected to audits at the end of the fiscal year. The detailed results of the company for FY 19 are expected to release on 9th April 2020.
FEN-Stock price performance
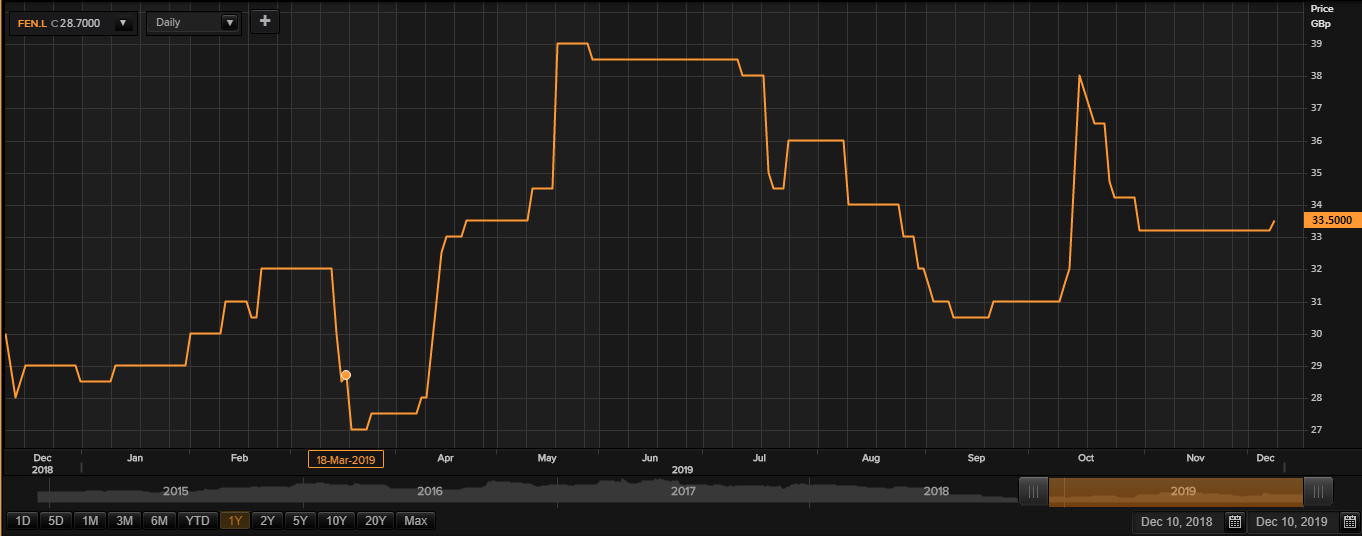
(Source: Thomson Reuters) Daily Chart as on Dec-10-19, before the market close
On 10th December 2019, while writing at 09:28 AM GMT, FEN shares were clocking a current market price of GBX 33.50 per share on the LSE. The companyâs market capitalisation was at £25.31 million at the time of writing.
On 11th June 2019, the shares of FEN have touched a new peak of GBX 40.00 and reached the lowest price level of GBX 25.08 on 19th March 2019 in the last 52 weeks. The companyâs shares were trading at 16.25 per cent lower from the 52-week high price mark and 33.57 per cent higher the 52-week low price mark at the current trading level as can be seen in the price chart.
The 5-day daily average traded volume of the stock was 9,106.20; 30 days daily average traded volume- 17,126.30 - and 90-days daily average traded volume â 26,930.64. The volatility of the companyâs stock was 64 per cent lower as compared with the index taken as the benchmark, as the beta of the companyâs stock was recorded at 0.34 with an annual dividend yield of 3.85 per cent.
The shares of the company have delivered a positive return of 8.06 per cent in the last quarter. The companyâs stock surged by 15.52 per cent from start of the year to till date. The companyâs stock has given investors 0.90 per cent of positive return in the last month.Â
Â
Â
Tesco PLC (LON:TSCO)
United Kingdom based retail company, Tesco PLC is into the business of Retailing related services and retail financial services such as banking & insurance. The shares of the company got quoted on the main market of the London Stock Exchange on 23rd December 1947.
TSCO-Recent developments
The company released a statement on its Asian businesses. The company has also taken up a strategic review of its operations in Thailand and Malaysia. The company is also looking at the possible sale of these businesses.
Â
TSCO-Stock price performance
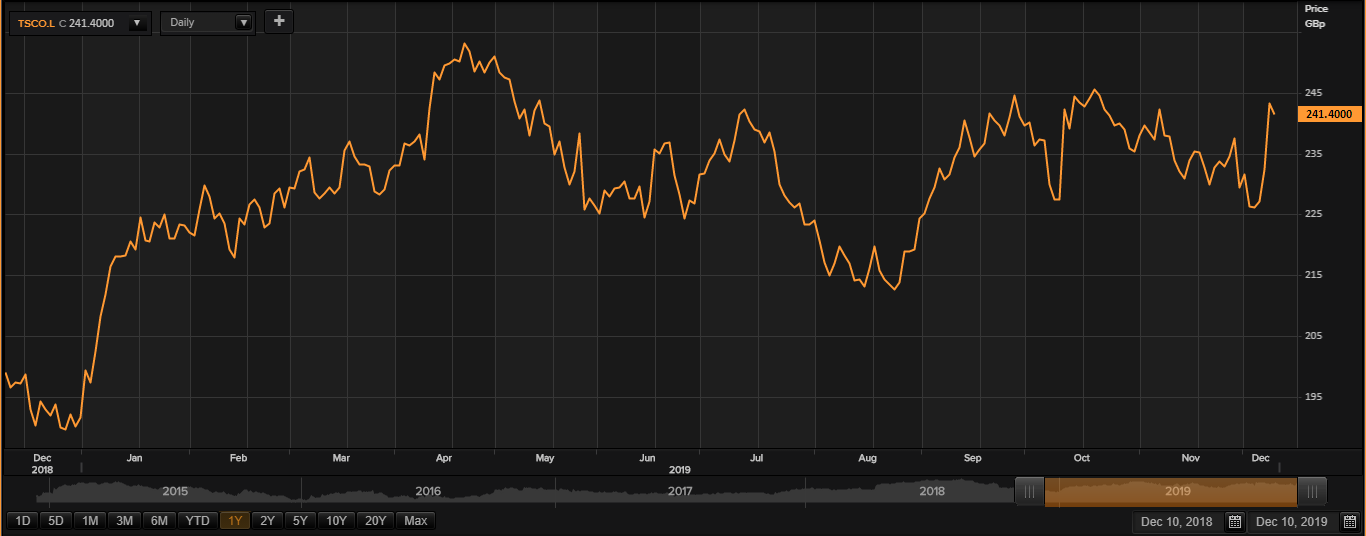
(Source: Thomson Reuters) Daily Chart as on Dec-10-19, before the market close
On 10th December 2019, while writing at 09:34 AM GMT, TSCO shares were clocking a current market price of GBX 241.40 per share on the LSE. The companyâs market capitalisation was at £23.80 billion at the time of writing.
On 23rd April 2019, the shares of TSCO have touched a new peak of GBX 254.10 and reached the lowest price level of GBX 187.05 on 28th December 2018 in the last 52 weeks. The companyâs shares were trading at 5.00 per cent lower from the 52-week high price mark and 29.06 per cent higher the 52-week low price mark at the current trading level as can be seen in the price chart.
The stockâs traded volume was hovering around 2,521,087 at the time of writing before the market close. The 5-day daily average traded volume of the stock was 18,584,212.80; 30 days daily average traded volume- 16,947,184.23- and 90-days daily average traded volume â 20,595,641.16. The volatility of the companyâs stock was 2 per cent higher as compared with the index taken as the benchmark, as the beta of the companyâs stock was recorded at 1.02 with an annual dividend yield of 2.91 per cent.
The shares of the company have delivered a positive return of 5.42 per cent in the last quarter. The companyâs stock plunged by 27.88 per cent from start of the year to till date. The companyâs stock has given investors 2.19 per cent of positive return in the last month.Â
