


Rosneft Oil Company announce results for 4Q and 12ÐÂ 2019
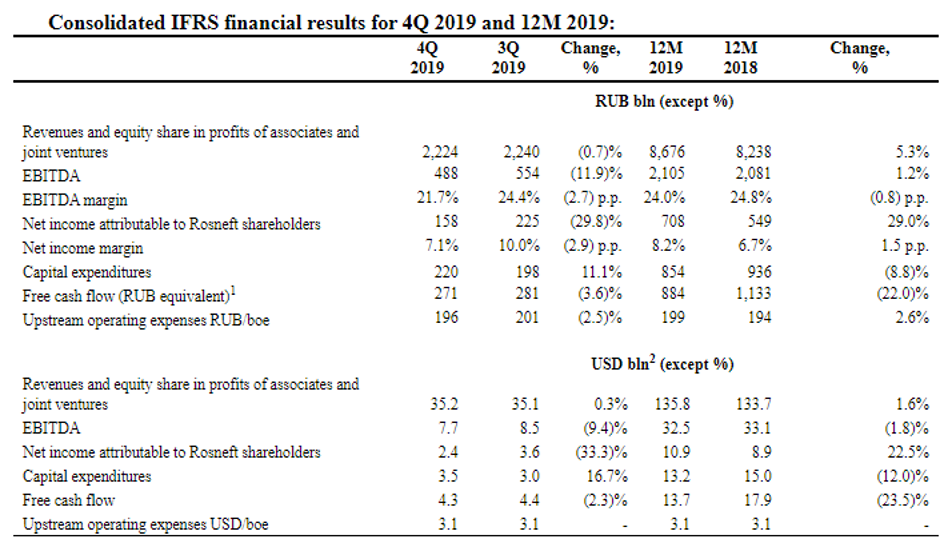
The Group revenues amounted to USD 35.2 billion in Q4 FY19. The revenue decreased in the Q4 FY19 from Q3 FY19 due to a decrease in the price of crude oil and the expected introduction of the new IMO requirements, which are lowering the prices of petroleum products. However, the company achieved sales growth of 5.3 per cent Year on Year in the twelve-month period 2019 driven by the reduction of the price of crude oil and higher sales volume of crude oil.
The companyâs EBITDA decreased quarter on quarter to USD 7.7 billion in Q4 FY19 due to surge in fuel oil prices in anticipation of the introduction of the stringent IMO requirements and decrease in sales of petroleum products. However, the companyâs EBITDA grew year on year to USD 32.5 billion in the twelve-month period 2019 due to cost efficiencies and higher crude oil sales volumes.
The company reduced its Capital expenditures to USD 13.2 billion in the year 2019 as compared to the previous year by optimising drilling program development. The company generated a free cash flow of USD 4.3 billion in Q4 FY19 and USD 13.7 billion in FY19. The company managed to lower its Net debt and trading liabilities by RUB 174 billion in the fiscal year 2019. The total dividend payments paid to shareholders by the company in FY19 was RUB 283 billion.
(Source: Companyâs filings, London Stock Exchange)
About Rosneft Oil Company
The leader of the oil sector in Russia and one of the largest public gas and oil corporation in the world, Rosneft Oil Company (LON:ROSN) focuses on appraisal and exploration of gas, oil and refined products. The company looks forward to developing offshore field projects of gas & gas condensate, and hydrocarbon fields and commercialise the products in Russia and abroad. The company aims to monetise the gas reserves by deploying best practices across the industry to drive growth and marketing the products in the best possible manner.
Rosneft Oil Company -Stock price performance
(Source: Thomson Reuters)
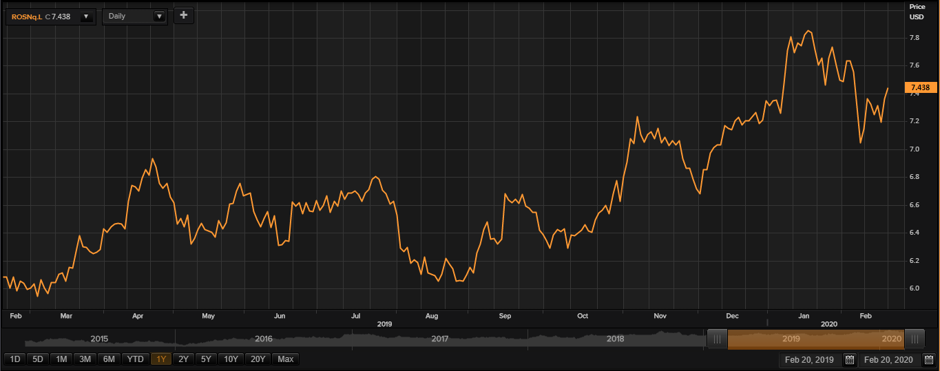
While writing (as on 20th February 2020, at 11:22 AM GMT), Rosneft Oil Companyâs shares were trading at USD 7.438 per share; surged by 1.06 per cent as compared to the previous day closing price level. The companyâs market capitalisation was around $77.71 billion.
Rosneft Oil Companyâs shares have clocked a high of USD 7.88 (as on 20 January 2020) and a low of USD 5.89 (as on 8 March 2019) in the past year. At the current price point, as quoted in the price chart, the companyâs shares were trading 5.61 per cent below the 52-week high price point and 26.28 per cent above the 52-week low price point.
At the time of writing, the stockâs volume before the market close, stood at 516,053. Stock's average daily traded volume for 5 days was 3,591,751.00; 30 days- 3,212,285.30 and 90 days â 2,510,793.43. The companyâs stock beta (180 days) was 0.96, which makes it slightly less volatile as against the benchmark index with a dividend yield of 5.69 per cent.
The stockâs average daily traded volume for 5 days surged by 11.81 per cent as against 30 days average traded volume. At the time of writing, the shares of the company were trading above the 60-days and 200-days SMA.
In the past 1 month, Rosneft Oil Companyâs shares have delivered a negative return of 5.91 per cent. On a YTD (Year-to-Date) time interval, the stock surged by approximately 2.08 per cent and was up by 3.87 per cent in the last three months.
Share's RSI (Relative Strength Index) for the 30-days, 14-days and 9-days was recorded at 51.16, 48.50 and 49.02 respectively. Also, the stockâs 3-days RSI was recorded at 63.13.Â
RPS Group PLC announce FY19 results
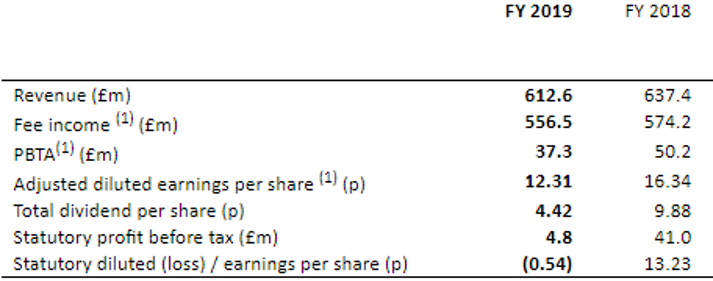
The company had to contend with several headwinds which significantly impacted on the results in FY19 for the period ended 31st December 2019. The companyâs revenue was down to £612.6 million in the fiscal year 2019 as compared to £637.4 million in the fiscal year 2018. The Groupâs PBTA stood at £37.3 million in the fiscal year 2019 as compared to £49.9 million (at constant currency basis) in the fiscal year 2018. The Fee income of the company decreased to £556.5 million in the fiscal year 2019 as compared to £571.4 million at constant currency in the fiscal year 2018.
The Profit before tax of the company was recorded at £4.8 million in the fiscal year 2019 as against £41 million in the fiscal year 2018. The companyâs Adjusted diluted EPS declined to 12.31 pence in the fiscal year 2019 as against 16.24 pence (at constant currency) for the fiscal year 2018. The companyâs statutory diluted loss per share stood at 0.54 pence in FY19. The company has responded well to difficult trading conditions and has revitalised its energy business. The company shall continue to invest but in a cautious manner.
(Source: Companyâs filings, London Stock Exchange)
RPS Group PLC (LON:RPS)
Incepted in 1970, RPS Group has operations in 125 nations across six geographies, using its deep expertise, RPS is a leader in global professional services comprising of five thousand consultants and service providers. In order to create shared value for a complex, urbanising and resource scarce world, the company is into the business of defining, designing and managing projects. The Group provides its services across several clusters such as exploration and development, planning and approvals, project and programme management, advisory and management consulting and many others, while catering to different sectors such as energy, defence and government services, property and water.
RPS Group PLCÂ -Stock price performance
(Source: Thomson Reuters)
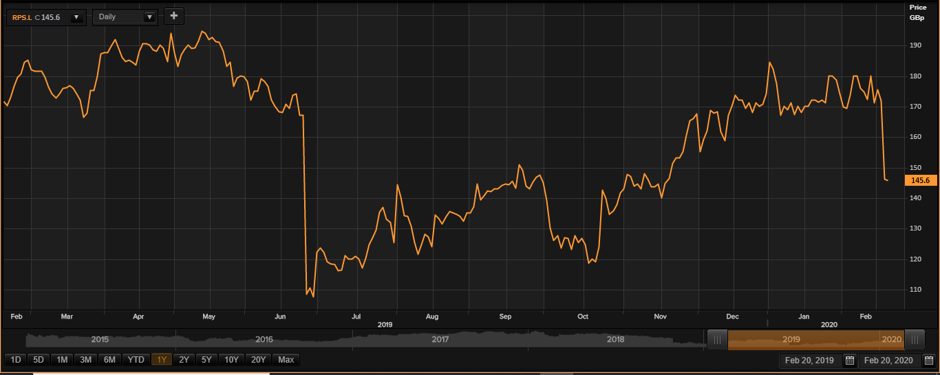
While writing (as on 20th February 2020, at 11:16 AM GMT), RPS Group PLCâs shares were trading at GBX 145.60 per share; lower by 0.27 per cent as compared to the previous day closing price level. The companyâs market capitalisation was around £333.81 million.
RPS Group PLCâs shares have clocked a high of GBX 198.00 (as on 17 May 2019) and a low of GBX 93.00 (as on 26 June 2019) in the past year. At the current price point, as quoted in the price chart, the companyâs shares were trading 26.46 per cent below the 52-week high price point and 56.56 per cent above the 52-week low price point.
At the time of writing, the stockâs volume before the market close, stood at 161,779. Stock's average daily traded volume for 5 days was 261,946.20; 30 days- 270,082.17 and 90 days â 265,167.53. The companyâs stock beta (180 days) was 1.07, which makes it more volatile as against the benchmark index with a dividend yield of 3.03 per cent.
The stockâs average daily traded volume for 5 days plunged by 3.01 per cent as against 30 days average traded volume. At the time of writing, the shares of the company were trading below the 60-days and 200-days SMA.
In the past 1 month, RPS Group PLCâs shares have delivered a negative return of 14.12 per cent. Also, on a YTD (Year-to-Date) time interval, the stock plunged by approximately 14.42 per cent and was up by 0.83 per cent in the last three months.
Share's RSI (Relative Strength Index) for the 30-days, 14-days and 9-days was recorded at 41.13, 31.11 and 25.21 respectively. Also, the stockâs 3-days RSI was recorded at 10.54.
