


_10_04_2024_16_38_50_427275.jpg)


Summary
- Metro Inc is a leading grocery and drugstores company. It runs 950 food stores and 650 drugstores.
- Since COVID-19 cases are surging in Canada, people will likely turn their attention to groceries and drugstores.
- Metro’s sales increased to C$ 4.19 billion in Q2 2021, up from C$ 3.99 billion in Q2 2020.
Metro Inc. (TSX:MRU) released its second-quarter results on April 21 and announced it achieved a profit of C$188.1 million, up from C$ 176.2 million in the same quarter of the previous year. The profit per diluted share amounted to C$ 0.75, up from C$ 0.69 in the second quarter of 2020.
The sales for the grocery and drugstore retailer said that its sales increased to C$ 4.19 billion in Q2 2021, up from C$ 3.99 billion in Q2 2020.
Since COVID-19 cases are surging in Canada, people will likely turn their attention to groceries and drugstores, since Metro Inc is a leading company in the country, its stock might be worth exploring.
A Look At Metro And Its Stock
Metro Inc. (TSX:MRU) runs 950 food stores under various brands like Metro and Metro Plus. It also runs pharmacy stores, and according to the company website, it currently runs 650 drugstores under different banners.
The company has a market cap of C$ 14.6 billion and holds a price-to-book (P/B) ratio of 2.374, according to TMX data. Metro posts a 13.10 per cent return on equity (ROE) and 5.96 per cent return on assets (ROA).
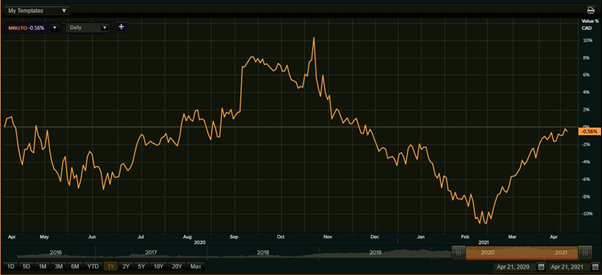
One-year performance of Metro Inc (Source: EODHD/Others)
In one month the stock grew by 4.8 per cent and its year-to-date (YTD) growth stands at 4.4 per cent. On the dividend front, the company distributes a C$ 0.25 quarterly dividend and it witnessed a dividend growth at the rate of 9.88 per cent in three years and 12.69 per cent in five years. It currently registers a dividend yield of 1.686 per cent.
The scrips were priced at C$ 59.31 at market close on April 20, 10.5 per cent down from its 52-week high of C$ 66.25 (November 9, 2020) and 12.7 per cent up from its 52-week low of C$ 52.63.
How Do The Financials Look?
The company's cash and cash equivalents increased to C$ 324.7 million in Q2 2021, up from $ 217.8 million in the same comparable period last year. During the same period, the food same-store sales climbed by 5.5 per cent and pharmacy same-store sales went down by 0.8 per cent.
The adjusted fully diluted net earnings per share were C$ 0.78 for the quarter, up from C$ 0.72 in Q2 2020.
The above constitutes a preliminary view and any interest in stocks should be evaluated further from an investment point of view.
