


Highlights
- Procter & Gamble (NYSE:PG) has a dividend yield of 2.15% and a P/E ratio of 28.32.
- PepsiCo’s (NASDAQ:PEP) P/E ratio is 29.27, the dividend yield is 2.49%, with an annualized dividend of US$4.30.
- Philip Morris International’s (NYSE:PM) dividend yield is 4.83%, and the annualized dividend is US$5.00.
The consumer staples sector produces essential items for daily use. These products include food, beverages, hygienic products, everyday goods, etc.
These are called non-cyclical items because of their daily use and are always in demand. So, the companies that produce them generally see stable growth.
These are often large companies with a long track record. They are steady, reliable, and economic upheavals don't affect them immediately. They also enjoy trust and popularity because of their long presence in the market.
The issue of labor shortage has been a major concern for the food industry lately, as many workers have left work during the pandemic and haven't returned due to health concerns.
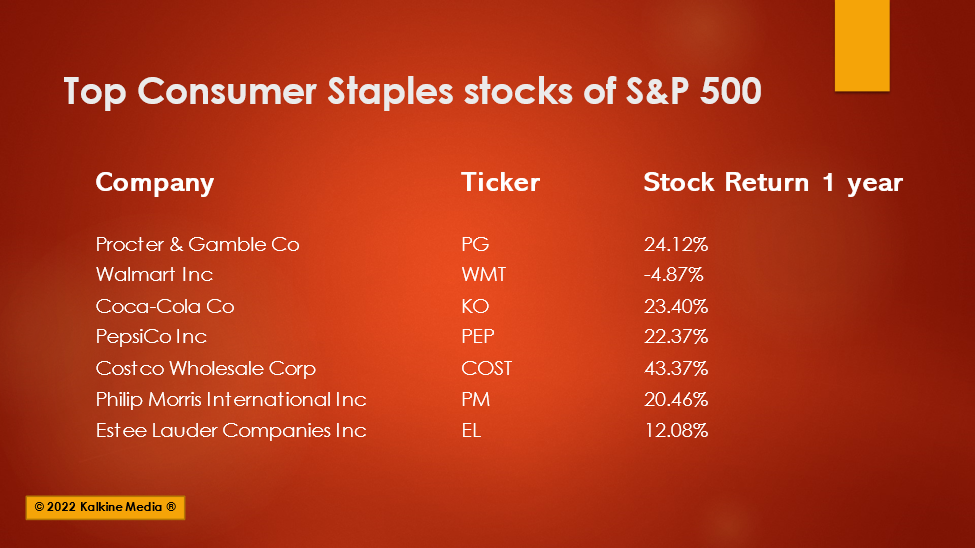
The companies are hiring temporary workers, who require training and additional costs – a new reality for most companies post the pandemic. Still, many of these companies have seen their profits balloon in consecutive quarters. Here we discuss the top seven consumer staples stocks on the S&P 500 based on market capitalization.
Also Read: Top penny stocks to explore in February
Procter & Gamble Company (NYSE:PG)
Market Cap: US$384.19 billion
Closing price on February 7, 2022: US$ 160.32
Procter & Gamble was founded in 1837. This Cincinnati, Ohio-based company is one of the largest consumer product manufacturers globally. Its leading brands include Pantene shampoo, Tide detergent, Charmin toilet paper, Pamper diapers, etc.
For the quarter ended December 31, 2021, its revenue was US$20.95 billion compared to US$19.75 billion in 2020. Its net income attributable to the company was US$4.22 billion or US$1.66 per share diluted, compared to US$3.85 billion or US$1.47 per share diluted in the December quarter of 2020.
Its P/E ratio is 28.32, the forward P/E for one year is 27.13, the dividend yield is 2.15%, and the annualized dividend is US$3.479.
Also Read: Top 50 stocks on S&P 500 index (Part I)
Walmart Inc. (NYSE:WMT)
Market Cap: US$384.67 billion
Closing price on February 7, 2022: US$ 137.96
Walmart is the largest retailer in America by sales. The company operated more than 11,400 stores at the end of fiscal 2021. It sells an extensive range of general merchandise and grocery items. It also operates e-commerce properties, including Flipkart and shoes.com.
For the three months ended October 31, 2021, the company reported net sales of US$140 billion compared to US$134.7 billion in the previous year. Its net income attributable to the company fell to US$3.1 billion or US$1.11 EPS diluted from US$5.14 billion or US$1.80 EPS diluted in the October quarter of 2020.
The Bentonville, Arkansas-based Walmart’s P/E ratio is 48.49, the forward P/E for one year is 21.52, the dividend yield is 1.58%, and the annualized dividend is US$2.20.
Also Read: Top 50 stocks on S&P 500 Index (Part II)
Also Read: Top 10 Nasdaq semiconductor stocks to explore
Coca-Cola Company (NYSE:KO)
Market Cap: US$267.89 billion
Closing price on February 7, 2022: US$61.60
Coca-Cola is a nonalcoholic beverage company. It owns and markets beverage brands, including Coke, Sprite, Fanta, Costa, Minute Maid, etc. The Georgia-based company makes the beverage base for its drinks that are further processed and distributed.
Coca-Cola will release its Q4 and full-year results on February 10.
Its operating revenue increased to US$10.04 billion in the quarter ended October 1, 2021, from US$8.65 billion in the year-ago period. The net income attributable to the company came in at US$2.47 billion or US$0.57 EPS diluted, versus US$1.74 billion or US$0.40 EPS diluted in the corresponding quarter of 2020.
Its P/E ratio is 30.4, the forward P/E for one year is 27.02, the dividend yield is 2.76%, and the annualized dividend is US$1.68.
Also Read: Top 7 healthcare stocks on NASDAQ to consider
PepsiCo, Inc. (NASDAQ:PEP)
Market Cap: US$237.57 billion
Closing price on February 7, 2022: US$171.81
PepsiCo, a global food and beverage company, makes and sells branded beverages such as Pepsi, Gatorade, Doritos, Lays, Ruffles, etc. It is based in Purchase, New York. It acquired SodaStream in 2018 and Rockstar Energy in 2020 to boost its beverage segment.
PepsiCo will announce its fourth-quarter and full-year results on February 10, 2022.
Its revenue and net income for the three months ended September 4, 2021, were US$20.19 billion and US$2.22 billion, respectively. For the same quarter in 2020, the revenue and net income were US$18.09 billion and US$2.29 billion, or US$1.65 per share diluted, respectively.
Its P/E ratio is 29.27, the forward P/E for one year is 27.49, the dividend yield is 2.49%, and the annualized dividend is US$4.30.
Also Read: What is NFT? How to create and sell?
Costco Wholesale Corporation (NASDAQ:COST)
Market Cap: US$231.5 billion
Closing price on February 7, 2022: US$515.89
Issaquah, Washington-based Costco sells consumer products through its warehouse club. It had 815 stores worldwide at the end of fiscal 2021. The company's inventories consist of household items. Costco earns profits from the membership fee it charges from the shoppers.
Its net sales increased by 15.5% to US$15.76 billion for the retail month of January, from US$13.64 billion for the same period last year.
For the quarter ended November 21, 2021, its revenue was US$50.36 billion compared to US$43.2 billion in the prior year. The net income came in at US$1.32 billion or US$2.98 per share diluted against US$1.17 billion or US$2.62 per share diluted in the same quarter in 2020.
Its P/E ratio is 44.9, the forward P/E for one year is 40.75, the dividend yield is 0.61%, and the annualized dividend is US$3.16.
Also Read: Top communication stocks on S&P 500 to watch
Philip Morris International Inc (NYSE:PM)
Market Cap: US$161.12 billion
Closing price on February 7, 2022: US$103.58
Philip Morris International is a tobacco company based in New York. It manufactures and sells cigarettes and other nicotine-containing products globally.
Its fourth-quarter and full-year results will come on February 10.
The revenue and net income for the quarter ended September 30, 2021, were US$8.12 billion and US$2.43 billion, respectively. The revenue was US$7.44 billion, and net income was US$2.31 billion, or US$1.48 EPS diluted, for the corresponding quarter in 2020.
Its P/E ratio is 17.97, the forward P/E for one year is 17.18, the dividend yield is 4.83%, and the annualized dividend is US$5.00.
Also Read: Top 7 financial stocks on NYSE to explore

Source - pixabay
Also Read: Top utility sector stocks of NYSE to watch
Estee Lauder Companies, Inc. (NYSE:EL)
Market Cap: US$112.37 billion
Closing price on February 7, 2022: US$314.43
Estee Lauder is one of the largest cosmetics companies in the world. The company operates in 150 countries and collects the highest revenue from Europe. It sells its products through department stores, multi-brand specialty beauty stores, freestanding stores, travel retail, e-commerce, salons, spas, and perfumeries.
The company posted net sales of US$5.53 billion in the quarter ended December 31, 2021, compared to US$4.85 billion in the previous year. Its net income more than doubled to US$1.09 billion or US$2.97 EPS diluted compared to US$0.873 billion or US$2.37 EPS diluted in the December quarter of 2020.
Its P/E ratio is 35.4, the forward P/E for one year is 41.43, the dividend yield is 0.77%, and the annualized dividend is US$2.40.
Also Read: Top S&P 500 consumer discretionary stocks to explore
Bottomline
The S&P 500 Consumer Staples Sector Index grew 17.45% in one year compared to the S&P 500 Index’s one-year return of 15.32%. The retirees prefer the non-cyclical industry as the companies are big, mature, and have consistent dividend payments.
