


_06_19_2026_12_34_15_139937.jpg)

Global dividends hit a new high in Q2 2019
As per a report that came out in August 2019, investors of the firms trading on the global stock exchanges received more than five hundred billion dollars in dividends during the second quarter of 2019, a new high for shareholdersâ pay-outs. Albeit, In spite of the dividends hitting a record high level in a quarterly period of US $513.8 billion (or £423 billion), the pace of year on year growth went down to only 1.1 per cent for the period, in comparison with almost 14 per cent in the same period during the preceding year.
Various stock experts and analysts, which have analysed such statistics from approximately 1,200 biggest companies, have suggested that this downfall is a reflection of the stifling global economy and at the same time also shows the strength of the dollar for the second quarter in 2019. Financial services businesses, as well as the big oil and gas companies, who proposed higher dividends, at a pace that was more than those of the other industries on an intrinsic level, hurtling out the impacts of foreign exchange as well as single term dividend pay-outs. Banking firms, as well as other financial services and insurance companies paid dividends that were approximately 9.9 per cent more, and energy firms paid out dividends at a 6 per cent increase.
Dividend performance during FY 2019
The above-mentioned dividend performance by the companies continued during the passing year, as listed organisations paid out approximately US $1.43 trillion worth dividends during the financial year 2019. The new high of annual dividend payout from trading firms has been credited to the robust performances of these companies in stock exchanges in Northern American region as well as in the emerging countries, which also included some unusually large amounts of special dividends paid during this period. However, this was also followed by a sudden rise in uncertainty in the investors mind globally, consequently slowing the annual pace of growth, partially due to the events that took place during the year, such as the snap British Election. The total growth in pay outs has been reported to be 3.5 per cent more than those made in 2018.
Various market experts and analysts who studied the dividends paid by the 1,200 of the worldâs largest companies in terms of market capitalisation in 2019, found that the investor receivables from the United Kingdom and European companies were less as compared to the global average dividend pay outs. Dividends to the investors of the oil and gas firms increased at a faster pace, by a 10th, but at the same time, the pay outs from technology, media and telecommunication shares fell.
Dividends from the companies listed on the London Stock Exchange reached US $105.8 billion or £81.2 billion in FY 2019. This was an increase of around 6.2 per cent, in comparison to FY 2018, primarily driven by large amounts of special dividends from metal and mining firms such as Rio Tinto (LON:RIO) and BHP (LON:BHP), as well as some Financial services companies such as the Royal Bank of Scotland (LON:RBS). Although, the United Kingdomâs intrinsic dividend growth of around 2.9 per cent fell short of the global average.
The following is the stock performances of some of the highest dividend-yielding stocks in the United Kingdom:
GFRD Stock Price Performance
As on 17th February 2020, at 11:00 A.M (Greenwich Mean Time), by the time of writing this report, the Galliford Try Holdings Plc Stock was trading at a price of GBX 200.15 per stock on the London Stock Exchange market, an increase in the value of 5.10 per cent or GBX 9.71 per stock, as opposed to the price of the stock on the previous trading day, which had been reported to be at GBX 190.44 per stock. The annual dividend of the company has been reported to be GBX 58.00 per share, and the annual dividend yield has been reported to be at 30.46 per cent. The last dividend ex-date of the company was reported to be November 07, 2019 and the dividend pay date was December 04, 2019.
The market capitalisation (M-Cap) of the stock stood at a value of GBP 211.49 million, with respect to the current market price of the stock of the company at the time of writing this report.
The beta of the Galliford Try Holdings Plcâs stock has been reported to be at 0.45, giving an idea that the movement in the stock price, is less fickle, as against the movement of the comparative benchmark index.
EVR Stock Price Performance
As on 17th February 2020, at 11:00 A.M (Greenwich Mean Time), by the time of writing this report, the Evraz Plc Stock was trading at a price of GBX 389.40 per stock on the London Stock Exchange market, an increase in the value of 1.01 per cent or GBX 3.90 per stock, as opposed to the price of the stock on the previous trading day, which had been reported to be at GBX 385.50 per stock. The annual dividend of the company has been reported to be GBX 82.74 per share, and the annual dividend yield has been reported to be at 21.46 per cent. The last dividend ex-date of the company was reported to be August 15, 2019 and the dividend pay date was September 05, 2019.
The market capitalisation (M-Cap) of the stock stood at a value of GBP 5.597 billion, with respect to the current market price of the stock of the company at the time of writing this report.
The beta of the Evraz Plcâs stock has been reported to be at 2.13, giving an idea that the movement in the stock price, is highly volatile, as against the movement of the comparative benchmark index.
AMGO Stock Price Performance
As on 17th February 2020, at 11:05 A.M (Greenwich Mean Time), by the time of writing this report, the Amigo Holdings Plc Stock was trading at a price of GBX 50.00 per stock on the London Stock Exchange market, a decline in the value of 2.34 per cent or GBX 1.20 per stock, as opposed to the price of the stock on the previous trading day, which had been reported to be at GBX 51.20 per stock. The annual dividend of the company has been reported to be GBX 10.55 per share, and the annual dividend yield has been reported to be at 20.61 per cent. The last dividend ex-date of the company was reported to be January 09, 2020 and the dividend pay date was January 29, 2020.
The market capitalisation (M-Cap) of the stock stood at a value of GBP 243.37 million, with respect to the current market price of the stock of the company at the time of writing this report.Â
PHAR Stock Price Performance
As on 17th February 2020, at 11:10 A.M (Greenwich Mean Time), by the time of writing this report, the Pharos Energy Plc Stock was trading at a price of GBX 38.50 per stock on the London Stock Exchange market, an increase in the value of 5.92 per cent or GBX 2.15 per stock, as opposed to the price of the stock on the previous trading day, which had been reported to be at GBX 36.35 per stock. The annual dividend of the company has been reported to be GBX 5.50 per share, and the annual dividend yield has been reported to be at 15.13 per cent. The last dividend ex-date of the company was reported to be May 09, 2019 and the dividend pay date was May 31, 2019.
The market capitalisation (M-Cap) of the stock stood at a value of GBP 144.50 million, with respect to the current market price of the stock of the company at the time of writing this report.
The beta of the Pharos Energy Plcâs stock has been reported to be at 1.35, giving an idea that the movement in the stock price, is more volatile, as against the movement of the comparative benchmark index.
STOB Stock Price Performance
As on 17th February 2020, at 11:15 A.M (Greenwich Mean Time), by the time of writing this report, the Stobart Group Limited Stock was trading at a price of GBX 93.70 per stock on the London Stock Exchange market, an increase in the value of 1.74 per cent or GBX 1.60 per stock, as opposed to the price of the stock on the previous trading day, which had been reported to be at GBX 92.10 per stock. The annual dividend of the company has been reported to be GBX 3.10Â per share and the annual dividend yield has been reported to be at 12.26Â per cent.
The last dividend ex-date of the company was reported to be June 20, 2019 and the dividend pay date was July 31, 2019.
The market capitalisation (M-Cap) of the stock stood at a value of GBP 16.90 billion, with respect to the current market price of the stock of the company at the time of writing this report.
The beta of the Stobart Group Limitedâs stock has been reported to be at 1.2831, giving an idea that the movement in the stock price, is more volatile, as against the movement of the comparative benchmark index.
Comparative share price chart of GFRD, EVR, AMGO, PHAR and STOB
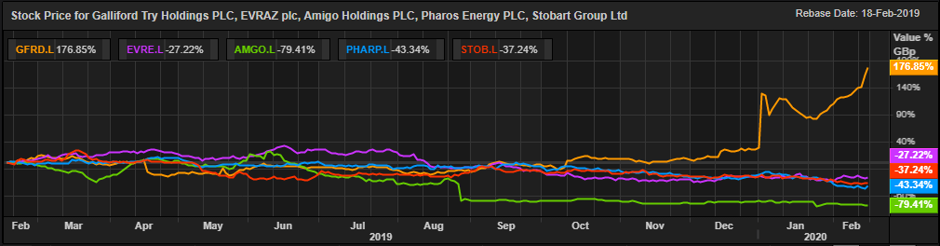
(Source: Thomson Reuters) Daily Chart as on 17-February-20, before the closing of the LSE Market
