
_02_06_2025_07_05_23_538703.jpg)


Coca Cola HBC AG (LON:CCH)
Switzerland based Coca Cola HBC AG is engaged in the business of production and distribution of non-alcoholic beverages. The company is a bottler of Coca Cola products. The company distributes Coca-Cola, Coca-Cola Zero, Coca-Cola Light, Fanta, and Sprite as well as water, energy drinks and juice.
CCH-Recent developments
The company announced the successful acquisition of a premium natural mineral water and adult sparkling beverages business based out of Italy, Lurisia. The acquisition was in line with previous similar acquisitions made by The CocaâCola Company.
CCH-Trading Update for Third Quarter, FY19

(Source: Companyâs filings, London Stock Exchange)
The companyâs performance was impacted by poor weather conditions which impacted volumes in the groupâs operating geographies in the third quarter of the fiscal year 2019. The companyâs net sales revenue on FX-neutral basis improved by 3.4 per cent and 5 per cent on a reported basis and volume surged by 1.1 per cent in the third quarter of the fiscal year 2019.
The growth for the company was broadly impacted by a 6.5 per cent FX-neutral growth in emerging markets, and 1.5 per cent FX-Neutral revenue growth in developed nations. The company expects FX-Neutral revenue growth to be in the range of 4 to 4.5 per cent, including 70 basis points contribution from Bambi for the fiscal year 2019.
CCH-Stock price performance
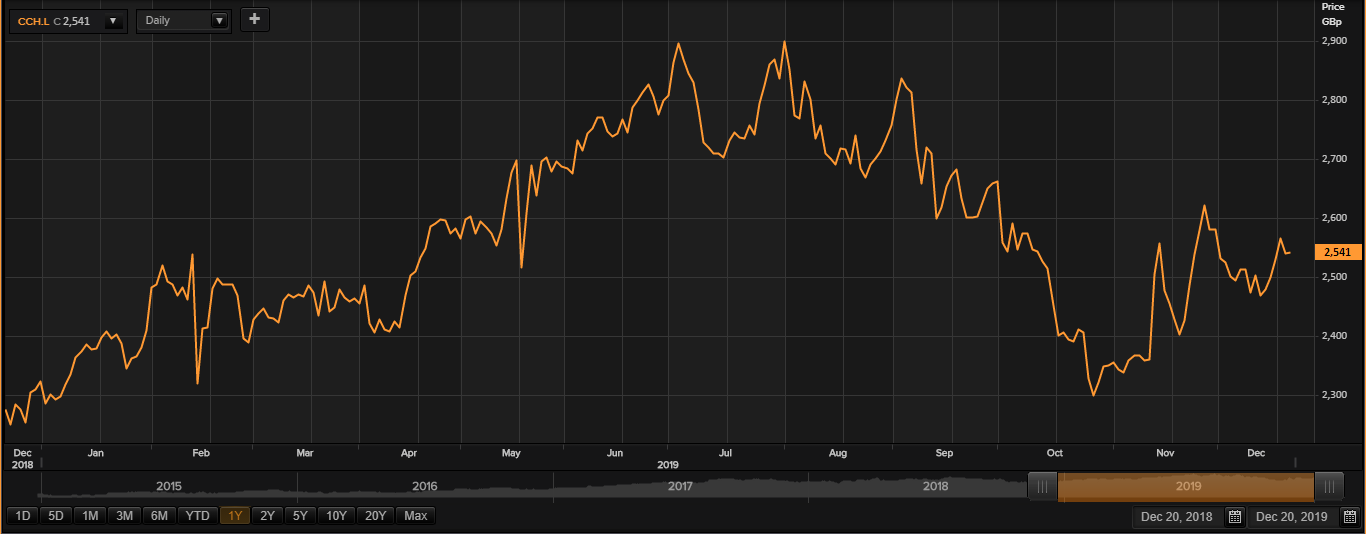
(Source: Thomson Reuters) Daily Chart as on Dec-20-19, before the LSE market close
While writing (as on 20th December 2019, at 08:41 PM GMT), Coca Cola HBC AGâs shares were trading at GBX 2,541.00 per share; which rose by 0.08 per cent in comparison to the previous day closing price level. Total market capitalisation of the group at the time of writing was hovering around £9.27 billion.
The shares of the Coca Cola HBC AG have struck a high of GBX 2,950.00 (as on July 04, 2019) and a low of GBX 2,207.18 (as on December 27, 2018) in the last twelve months. At the current price point, as quoted in the price chart, the companyâs shares were trading 13.86 per cent below the high price point attained in the last twelve months and 14.20 per cent above the low price point attained in the last twelve months.
At the time of writing, the stock's average daily traded volume for 5 days was 749,717.20; 30 days- 823,081.93 and 90 days â 663,012.39. The companyâs stock beta (5Y monthly) stood at 0.69, which implies that the companyâs stock is less volatile in comparison to the benchmark index along with a dividend yield of 2.01 per cent.
The shares of the company were trading above the 30-days and 60-days SMA while writing. The stockâs daily average traded volume for 5 days dipped by 8.91 per cent in contrast to 30 days daily average traded volume.
On a YTD (Year-to-Date) time interval, the shares of Coca Cola HBC AG surged by approximately 9.97 per cent and were down by 5.30 per cent in the last quarter. However, Coca Cola HBC AGâs shares have delivered 4.57 per cent positive return in the last one-month period.
RSI (Relative Strength Index) of the Coca Cola HBC AGâs shares for the 30-days, 14-days and 9-days were hovering in the mid-range, were recorded at 51.59, 55.44 and 56.89 respectively. In addition, the RSI for 3-days of the companyâs stock stood at 59.36.
Imperial Brands PLC (LON:IMB)
British-based Imperial Brands PLC is a fast-moving consumer business, with operational interest in a variety of fine cut and smokeless tobaccos, cigarettes, papers and cigars. The companyâs geographical operational segments are differentiated into the United States, Growth Markets, Returns Markets South, Returns Markets North, and Logistics.
IMB-Business performance for the financial year 2019 period ended 30 September 2019
(Source: London Stock Exchange, Companyâs filings)
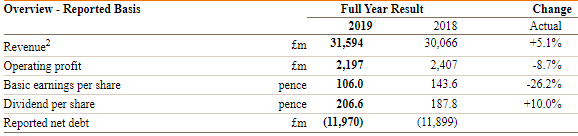
The company's total adjusted operating profit declined by 0.5 per cent on an actual basis (down by 2.4 per cent at constant currency) to £3,749 million in contrast to the same period previous year. For the financial year 2019, the adjusted earnings per share improved marginally by 0.4 per cent on an actual basis to 273.3 pence in contrast to 272.2 pence in FY18.
The group's net revenue for the financial year 2019 surged by 2.2 per cent, driven by the progress in tobacco and Net Generation Product. In addition, the companyâs major tobacco net revenue increased by 2.7 per cent on an actual basis (up by 1.1 per cent at constant currency basis) to £7,713 million in contrast to £7,510 million in the financial year 2018.
The company had paid two interim dividends totalling 62.56 pence in June 2019 and September 2019, in line with the quarterly dividend payment policy to give shareholders a more regular cash return. The companyâs board endorsed an additional interim dividend of 72 pence per share and will recommend a final dividend of 72.01 pence per share, bringing the total dividend to 206.57 pence per share in the year 2019. The total tobacco volume stood at 244.2 billion SE in FY19.
The company faced quite a few challenges, specifically on account of weaker trading conditions in the Next Generation Products in the fiscal year 2019.
IMB-Stock price performance
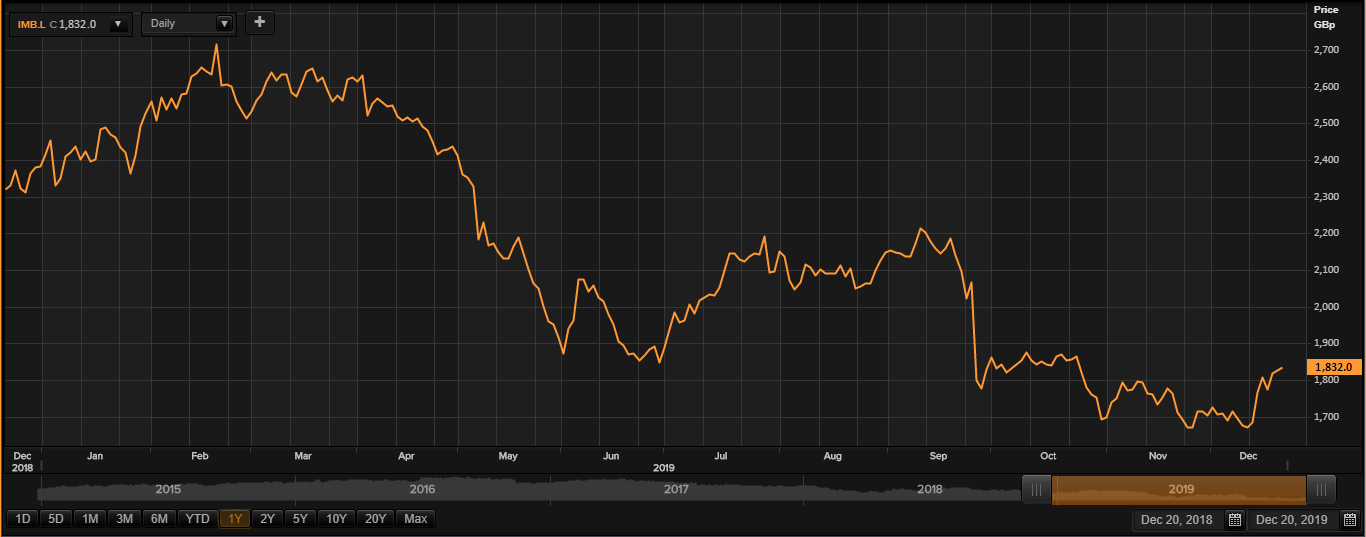
(Source: Thomson Reuters) Daily Chart as on Dec-20-19, before the LSE market close
While writing (as on 20th December 2019, at 08:33 AM GMT), Imperial Brands PLCâs shares were trading at GBX 1,832.00 per share; which were up by 0.34 per cent in comparison to the previous day closing price level. Total market capitalisation of the group at the time of writing was hovering around £17.37 billion.
The shares of the Imperial Brands PLC have struck a high of GBX 2,713.50 (as on February 20, 2019) and a low of GBX 1,636.58 (as on December 11, 2019) in the last twelve months. At the current price point, as quoted in the price chart, the companyâs shares were trading 32.49 per cent below the high price point attained in the last twelve months and 11.94 per cent above the low price point attained in the last twelve months.
At the time of writing, the stock's average daily traded volume for 5 days was 3,242,732.60; 30 days- 2,979,003.37 and 90 days â 2,620,251.74. The companyâs stock beta (5Y monthly) stood at 1.05, which implies that the companyâs stock is less volatile in comparison to the benchmark index along with a dividend yield of 11.31 per cent.
The shares of the company were trading above the 30-days and 60-days SMA while writing. The stockâs daily average traded volume for 5 days was up by 8.85 per cent in contrast to 30 days daily average traded volume.
On a YTD (Year-to-Date) time interval, the shares of Imperial Brands PLC plunged by approximately 23.19 per cent and were down by 16.40 per cent in the last quarter. However, Imperial Brands PLCâs shares have delivered positive return of 2.86 per cent in the last one-month period.
RSI (Relative Strength Index) of the Imperial Brands PLCâs shares for the 30-days, 14-days and 9-days were hovering in the mid-range, were recorded at 52.02, 62.22 and 68.81 respectively. In addition, the RSI for 3-days of the companyâs stock stood at 80.34.
