


Bango PLC
Bango PLC (BGO) is known for its mobile payment platform, which facilitates e-commerce. The Company's focus is to develop and commercialises technology to empower end users to do transactions seamlessly for online available content and media on smartphones and other high-end devices.
The company operates in two segments, namely- End user transactions and charging fees for usage of the platform. The End-user transactions capture the fees paid by end users for accessing paid content provided by digital merchants; Bango might act as an agent sometimes.
The fee-based platform segment covers the revenue generated from the digital merchants and other content providers in consideration of package fees and other services such as business analytics and operator connections.
Recent News
 FinnCap Ltd will serve as Bangoâs Nominated Adviser and Broker with effect from July 4, 2019.
The company has partnered with AppScatter (data intelligence and app management platform), to target users who are most likely to spend and generate revenue for the company. Â This move will help in penetrating the niche market of digital consumers who are responsible for driving 80 per cent of the revenue. This move by the company will connect these 'important users' to app developers.
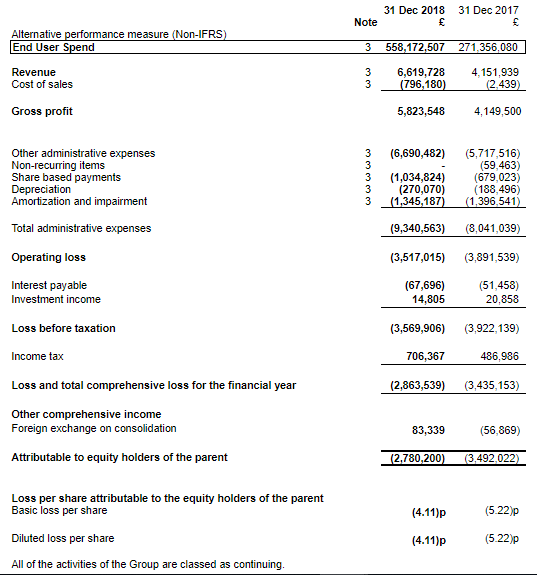
Financial Highlights for Financial Year 2018 (£)
(Source: Companyâs filings, LSE)
Â
The End User Spend (EUS) surged by 106 per cent to £558.2 million this year as against £271.4 million in FY17. The EUS reflects sales through e-commerce powered by Bango mobile platform. Thus, a rise in EUS means an increase in the number of transactions.
The revenue surged by around 60 per cent to £6.62 million this year as against £4.15 million in FY17. The company generates revenue from each transaction that takes place on the Bango platform. The business model is such that the revenue stream is either fee-based (based on the value of the transaction) or a fixed fee per transaction.
 The gross profit stood at £5,823,548 this year as against £4,149,500 in FY17. The companyâs total admin costs stood at £6.69 million this year as against £5.72million in FY17. The companyâs operating loss stood at £3.5 million this year and has shown improvement from a loss of £3.9 million in FY17. The cash balances of the company plunged by roughly £1 million to £3.81 million this year as against £4.85 million in FY17. The companyâs net assets surged to £16.0 million this year as against £10.7 million in FY17.
 Share price performance
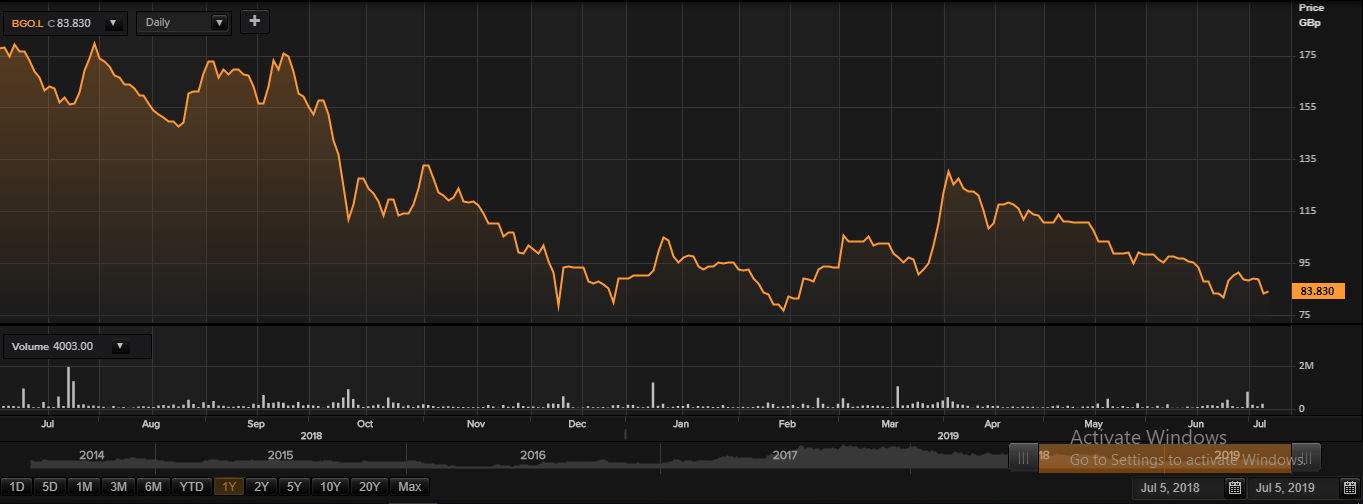
Daily Chart as at July-05-19, before the market close (Source: Thomson Reuters)
On July 05, 2019, at the time of writing (before the market close, at 10:17 AM GMT), Bango Plc shares were trading at GBX 83.83, up by 1 per cent against the previous day closing price.
Stock's 52 weeks High and Low is GBX 182.00/GBX 73.04. At the time of writing, the share was trading 53.93 per cent lower than the 52w High and 14.77 per cent higher than the 52w low. Stock's average traded volume for 5 days was 247,776.60; 30 days â 117,616.67and 90 days â 139,363.03.
The average traded volume for 5 days was up by 110.66 per cent as compared to the 30 days average traded volume. The market capitalisation of the company stood at £58.45 million.
C&C Group PLC
C&C Group plc (CCR) is into production and supply of cider, alcohol-based drinks, aerated drinks and bottled water. The company is known for some prominent brands such as Tennent's, Caledonia Best, Heverlee, Magners, K cider and Chaplin & Cork's.
Trading Update from the beginning of March 2019 to July 4, 2019
The company had an excellent start for the FY20. In the Quarter ending July 2019, the companyâs targets are in accordance with the expectations. The company generates most of its revenue from its UK business post-acquisition of Bibendum and Matthew Clark, is looking forward to including itself as a part of FTSE UK Index series.
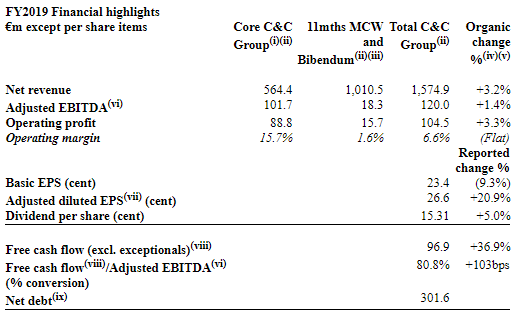
Financial Highlights for FY19 (â¬, million)
Â
(Source: Companyâs filings, LSE)
Â
The companyâs reported total group revenue stood at â¬1,574.9 million, reflecting an upside of 3.2 per cent on an organic basis for the period. The increase in revenue was driven by the acquisition of Bibendum and Matthew Clark. The Adjusted EBITDA surged by 1.4 per cent on an organic basis to â¬120 million in FY19. In FY19, the operating profit stood at â¬104.5 million, reflecting organic growth of 3.3 per cent. The companyâs total basic EPS stood at 23.4 cents and adjusted diluted EPS was at 26.6 cents for the period. The companyâs dividend per share stood at 15.31 cent in FY19.
Share price performance
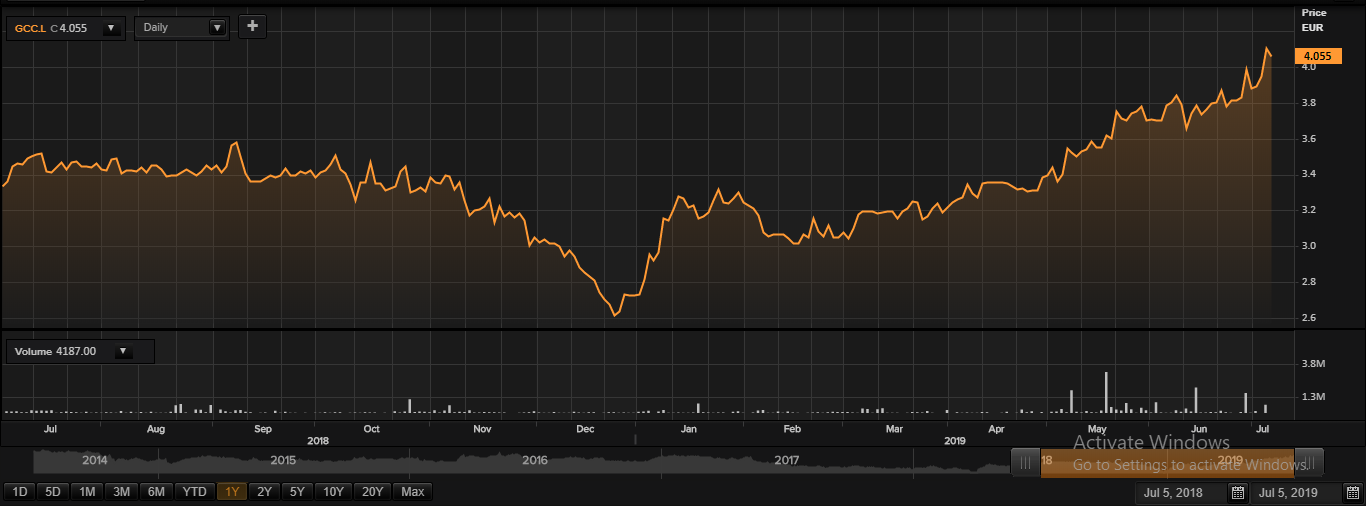
Daily Chart as at July-05-19, before the market close (Source: Thomson Reuters)
At the time of writing (as on July 05, 2019, at 01:28 PM GMT), shares of C&C Group plc were quoting at EUR 4.055 per share; down by 1.14 per cent against the yesterday's closing price level. The market capitalisation of the company stood at â¬1.27 billion.
In the last 52-weeks, shares of C&C Group plc have registered a high of EUR 4.14 (as on Jul 04, 2019) and a low of EUR 2.56 (as on Dec 24, 2018). At the current trading level, as quoted in the price chart, its shares were trading 2.05 per cent below the 52-week high price level and 58.39 per cent above the 52-week low price level.
The stockâs volume (before the market close, at the time of writing) stood at 4,187. Stock's average traded volume for 5 days was 467,728.00; 30 days- 278,716.37 and 90 days â 204,914.16. The average traded volume for 5 days was up by 67.82 per cent as compared to the 30 days average traded volume. The companyâs stock beta was 0.71, reflecting lower volatility as compared to the benchmark index.
The shares of the company (at the time of writing) were trading above the 30-days and 60-days SMA, which shows a positive trend in the stock price movement and could further move up from the current trading levels.
In the past 1 year, shares of C&C Group plc have delivered a positive price return of 23.11 per cent. Also, on a year-to-date basis, the stock was up by approximately 50.69 per cent and surged by 25.46 per cent in the past three months.
Share's RSI for the 30-days, 14-days and 9-days stood at 67.07, 70.16 and 73.52 respectively. Also, the stockâs 3-days RSI stood at 87.12.
The volatility of the stock for 200 Days, 90 Days, 30 Days stood at 26.39, 22.79and 26.70 respectively.
Directa Plus PLC
Directa Plus PLC (DCTA) produces and supplies graphene-based products for domestic and industrial purposes. The Company owns the G+ brand, which offers a variety of graphene-based products which are developed for a specific purpose and are ready-to-use in both domestic and industrial markets. There are various sub-categories of the G+ brand which are designed to cater to specific needs such as Basic G+, Ultra G+, Liquid G+, Pure G+, Zapp G+, Paste G+ and Dub-Masterplast G+. These requirements mainly come from textiles, tires, composite materials and environmental solutions such as treatment of contaminated water and soils.
Recent News
The company was granted a patent by the United States Patent and Trademark authority regarding the Company's technology to produce a water-based dispersion of pristine graphene nanoplatelets (GNPs) which further strengthened the companyâs product portfolio. This technology provides an ink based on G+ graphene product. The productâs main USP is, it possesses a higher degree of dispersibility in any water-based formulation (host) making the incorporation process easier. This product can be used in textiles, electrical conductivity, coating applications etc.
Financial Highlights for FY18 (â¬)
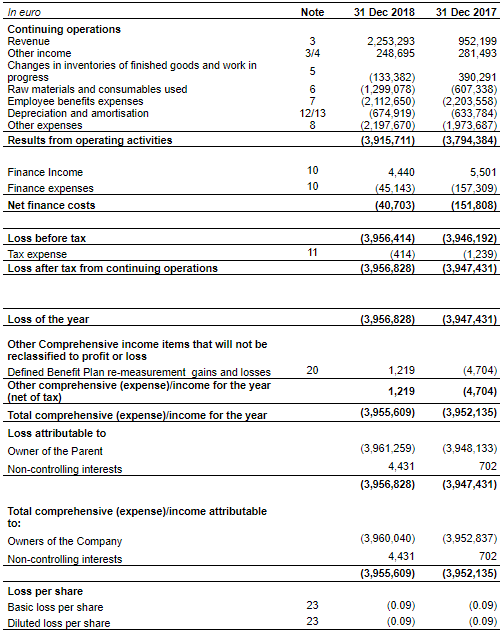
(Source: Companyâs filings, LSE)
Â
The revenue from sales and service stood at â¬2.25 million this year, which has doubled itself as against â¬0.95 million in FY17. The total income of the company (with grant included) was twice this year (stood at â¬2.50 million) as against â¬1.23 million in FY17. The loss after tax of the company stood at â¬3.96 million this year as against the loss of â¬3.95 million in FY17, which was nearly the same. The company was successful in raising funds of £3.45 million in December plus proceeds of £1.32 million received post period through the successful placement of shares.
Share price performance
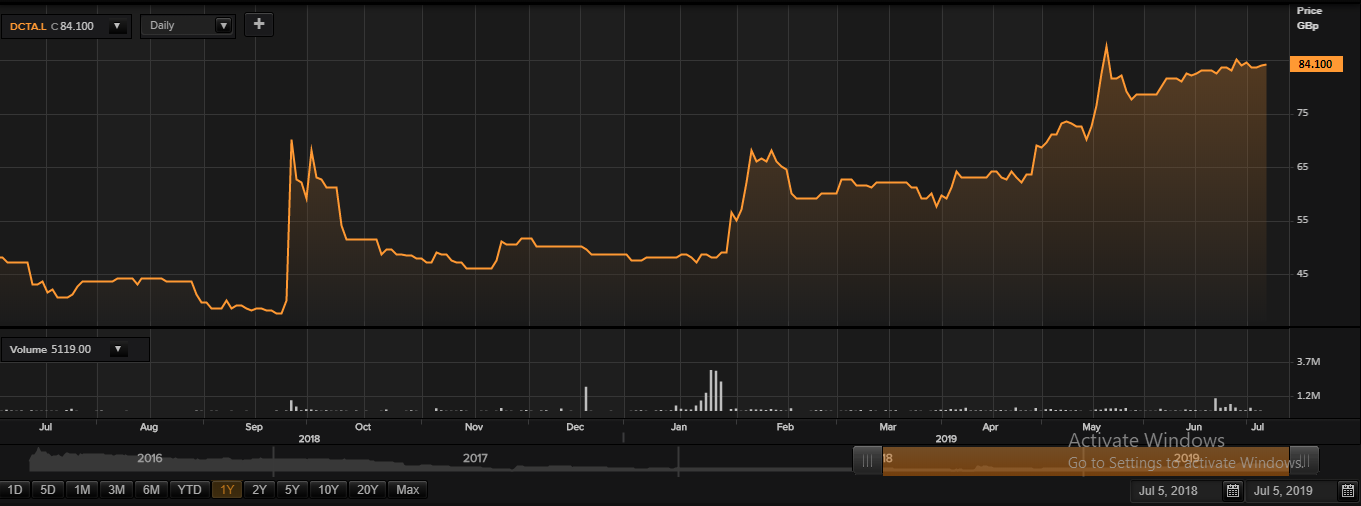
Daily Chart as at July-05-19, before the market close (Source: Thomson Reuters)
At the time of writing (as on July 05, 2019, at 02:11 PM GMT), shares of Directa Plus PLC were quoting at GBX 84.10 per share; up by 0.11 per cent against the yesterday's closing price level. The companyâs market capitalisation stood at £42.92 million.
In the last 52-weeks, shares of Directa Plus PLC have registered a high of GBX 90.00 (as on May 21, 2019) and a low of GBX 36.10 (as on Sep 21, 2018). At the current trading level, as quoted in the price chart, its shares were trading 6.55 per cent below the 52-week high price level and 132.96 per cent above the 52-week low price level.
The stockâs volume (before the market close, at the time of writing) stood at 20,418. Stock's average traded volume for 5 days was 87,001.20; 30 days- 135,840.83 and 90 days â 86,695.88. The average traded volume for 5 days was down by 35.95 per cent as compared to the 30 days average traded volume. The companyâs stock beta was 1.62, reflecting much higher volatility as compared to the benchmark index.
The shares of the company (at the time of writing) were trading above the 30-days and 60-days SMA, which shows a positive trend in the stock price movement and could further move up from the current trading levels.
In the past 1 year, shares of Directa Plus PLC have delivered a positive price return of 75 per cent. Also, on a year-to-date basis, the stock was up by approximately 73.20 per cent and surged by 31.25 per cent in the past three months.
Share's RSI for the 30-days, 14-days and 9-days stood at 63.58, 61.90 and 60.03 respectively. Also, the stockâs 3-days RSI stood at 57.82.
The volatility of the stock for 200 Days, 90 Days, 30 Days stood at 77.96, 35.13 and 19.15 respectively.
