


Global businesses, in the last over a month have gone through some major hiccups, due to the coronavirus outbreak. The Covid-19 virus, which is now considered a global epidemic, has affected more than 80000 people till now, while there have been approximately 2800 deaths because of the virus.
Global agencies have already started estimating the economic damage that the spread of this virus will have. This damage is not just limited to China or the neighbouring countries anymore but has now reached to many far-furlong areas of the globe. As per a research conducted by experts from the department of economics of the University of Oxford, it has been estimated that the monetary and financial loss due to the outbreak of this pandemic could reach up to US $1.1 trillion, making it the biggest pandemic outbreak in terms of both social and economic loss since the SARS outbreak in 2003.
Additionally, new reports have suggested that the travel and tourism industry all across the world will have to brace up for a tough time ahead, as Covid-19 is proving to be a major operational hindrance for travel and tourism countries across the globe. Air travel and maritime spaces have already seen a significant decline in the demand, followed by logistics businesses, primarily due to the travel advisories being issued by various government institutions. This has been followed by a massive slump in demand for the European Travel and Tourism industry, since the outbreak has now reached the European continent, primarily Italy, where, 11 deaths have already been confirmed due to the Covid-19. In the country, 11 towns are now under seize, and other neighbouring countries such as Austria and Croatia also have reported their first cases of Covid-19. Now itâs becoming readily apparent that the impact of this outbreak could be even wider than what has been previously estimated.
The spread has caused a huge reduction in the number of tourists travelling to and from Italy, while other countries are also now alerting and advising its citizens not to travel other parts of the continent for a while.
US travel and tourism space also hit
Experts are anticipating that over the next four years, the decline in demand for the US Travel and Tourism space would have a hit of around US $10 billion. According to a research report available in media, Chinese visitors to the US spent a little over US $34 billion on travel and transportation services in 2019.
The number of visits from China to the US has grown by around 13 times since the year 2002. All this suffered a major setback in the month of February, as there was due to drop in travel from China to US, which is reportedly expected to be as high as 28 per cent in the year 2020. The recovery from this will take at least four years, across which, the industry might end up losing around US $10 billion.
Some UK Travel companies have also faced serious challenges, and their stocks, trading on the London Stock Exchange have seen significant jittery, especially in the last one week. Following is a brief look of some of the important stocks, that are likely to experience additional volatility, with the continuation of this outbreak.
TUI Stock Price Performance
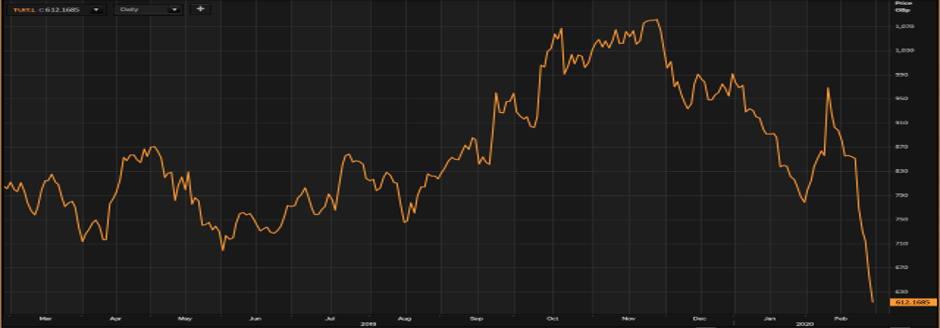
(Source: Thomson Reuters) Daily Chart as on 28-February-20, before the closing of the LSE Market
As on 28th February 2020, at 10:00 A.M (Greenwich Mean Time), by the time of writing this report, the TUI AG stock was trading at a price of GBX 612.16 per stock on the London Stock Exchange market, a decline in the value of 6.65 per cent or GBX 43.64 per stock, as opposed to the price of the stock on the previous trading day, which had been reported to be at GBX 655.80 per stock. At the time of writing this report, the market capitalisation of TUI AG has been reported to be at a value of EUR 4.530 billion, with respect to the current trading price of the companyâs stock.
It has been reported that the TUI AG stock had lost around 23.50 per cent in value, in the last twelve months, since February 28, 2019, when the stock was trading at a price of GBX 800.200 per stock at the time of the close of the market. It has also been reported that the companyâs stock has lost approximately 25.51 per cent, in the last six months, in comparison with the stock price of GBX 821.80 at the time of the close of the market as on August 28, 2019. TUI AGâs stock has been reported to have lost 24.96 per cent, in the previous thirty daysâ time from the stock price of GBX 815.80 per stock that the stock set as on January 28, 2020.
The beta of the stock of the company was reported at a value of 0.9216 at the time of writing. This indicates to the fact that the movement in the price of the stock, is less volatile, as opposed to the movement in the value of the comparative benchmark index.
IAG Stock Price Performance
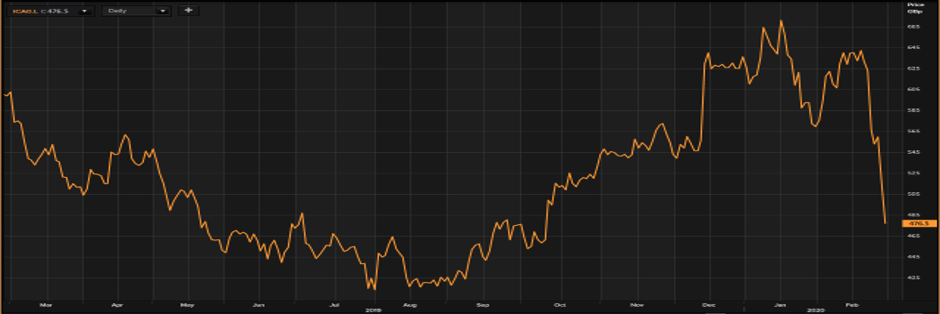
(Source: Thomson Reuters) Daily Chart as on 28-February-20, before the closing of the LSE Market
As on 28th February 2020, at 10:05 A.M (Greenwich Mean Time), by the time of writing this report, the International Consolidated Airlines Group SA Stock was trading at a price of GBX 476.50 per stock on the London stock Exchange market, a decline in the value of 7.55 per cent or GBX 38.90 per stock, as opposed to the price of the stock on the previous trading day, which had been reported to be at GBX 515.40 per stock. At the time of writing this report, the market capitalisation of International Consolidated Airlines Group SA has been reported to be at a value of GBP 10.360 billion, with respect to the current trading price of the companyâs stock.
It has been reported that the International Consolidated Airlines Group SA stock had lost around 20.45 per cent in value, in the last twelve months, since February 28, 2019, when the stock was trading at a price of GBX 599.00 per stock at the time of the close of the market. It has also been reported that the companyâs stock has gained approximately 14.35 per cent, in the last six months, in comparison with the stock price of GBX 416.70 at the time of the close of the market as on August 28, 2019. International Consolidated Airlines Group SAâs stock has been reported to have lost 19.56 per cent, in the previous thirty daysâ time from the stock price of GBX 592.40 per stock that the stock set as on January 28, 2020.
The beta of the stock of the company was reported at a value of 0.7958 at the time of writing. This indicates to the fact that the movement in the price of the stock, is less volatile, as opposed to the movement in the value of the comparative benchmark index.
EZJ Stock Price Performance
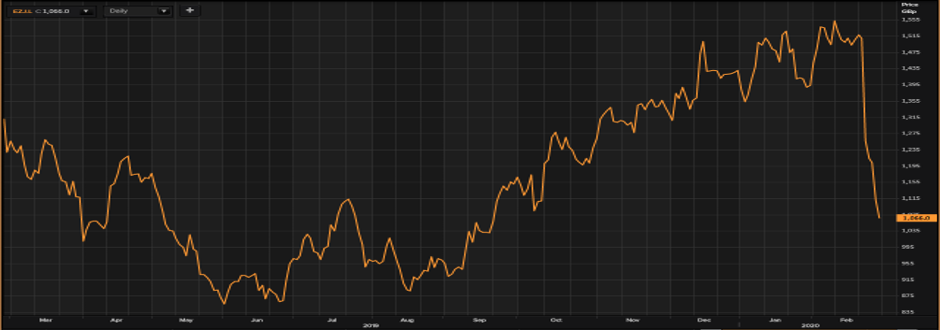
(Source: Thomson Reuters) Daily Chart as on 28-February-20, before the closing of the LSE Market
As on 28th February 2020, at 10:10 A.M (Greenwich Mean Time), by the time of writing this report, the EasyJet Plc stock was trading at a price of GBX 1066.00 per stock on the London Stock Exchange market, a decline in the value of 3.96 per cent or GBX 44.00 per stock, as opposed to the price of the stock on the previous trading day, which had been reported to be at GBX 1110.00 per stock. At the time of writing this report, the market capitalisation of EasyJet Plc has been reported to be at a value of GBP 4.410 billion, with respect to the current trading price of the companyâs stock.
It has been reported that the EasyJet Plc stock had lost around 13.16 per cent in value, in the last twelve months, since February 28, 2019, when the stock was trading at a price of GBX 1227.50 per stock at the time of the close of the market. It has also been reported that the companyâs stock has gained approximately 12.83 per cent, in the last six months, in comparison with the stock price of GBX 944.80 at the time of the close of the market as on August 28, 2019. EasyJet Plcâs stock has been reported to have lost 24.45 per cent, in the previous thirty daysâ time from the stock price of GBX 1411.00 per stock that the stock set as on January 28, 2020.
The beta of the stock of the company was reported at a value of 0.8326 at the time of writing. This indicates to the fact that the movement in the price of the stock, is less volatile, as opposed to the movement in the value of the comparative benchmark index.
