


Volume plays a vital role in the technical analysis and overlooking it may sometimes lead to adverse results. Volume represents the number of shares or contracts that have been traded in a particular period. In simple words, the volume is the number of shares that changed hands during a given period. Stocks with high volumes are considered more liquid and liquidity in stocks helps in easier and faster execution of the order. In general, the volume is displayed by histogram and usually available below the price action on a standard chart.
The volume analysis involves comparing the current volume with the historic volume and/or analysis of the volume trend. The combination of volume with the price action and other technical indicators helps in identifying the strength of the current trend or possible reversal in trend.The following table represents the general analysis of price trend when combined with volume.
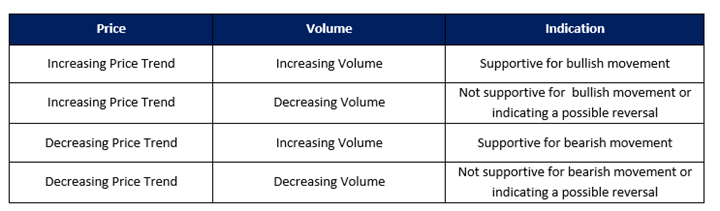
Volume plays a critical role in the breakout confirmations of price patterns, support, resistance, trend line breakout, etc. Any breakout accompanied by higher volumes confirms the price action and vice versa. Price patterns such as Head and Shoulders, Double Top & Double Bottom, Triangles, etc. relies upon the volume at the time of breakout for future direction. Volume confirmation is an important factor in the support, resistance, and trend line breakout, and any breakout with a low volume or decreasing volume trend are considered to be less reliable. It is always advisable to analyze the other technical tools for confirmation before taking entry in a share if the breakout is not confirmed by rising volume.
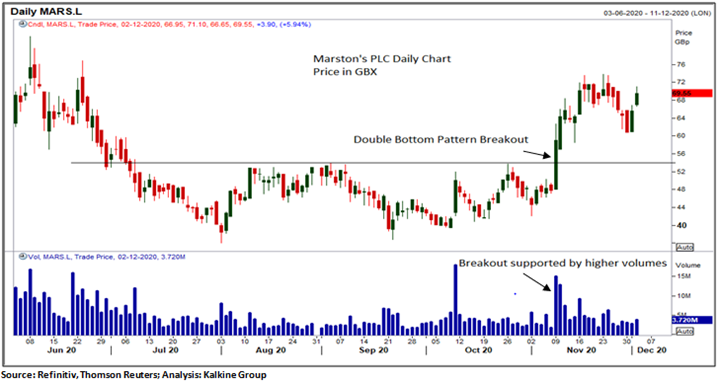
Following is the example of Marston’s PLC (LON:MARS). MARS broke above the resistance of the double bottom pattern (bullish reversal pattern) on the daily chart and the breakout was supported by the higher volumes. After the breakout of the pattern, it witnessed an almost ~37% rise in the price in 9 days . The volume confirmed the price action and provided further strength to the trend reversal.
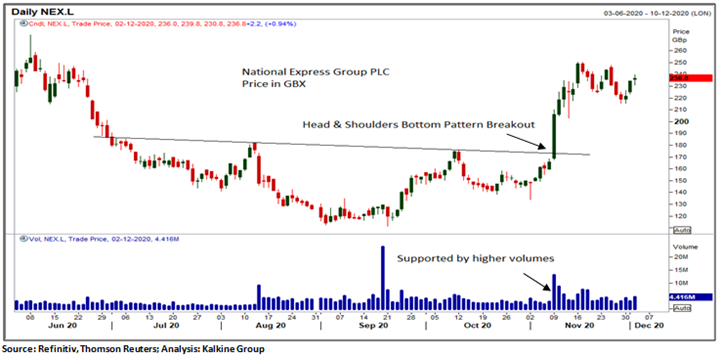
The next example is the National Express Group PLC (LON:NEX). NEX broke above the neckline of the Head & Shoulders Bottom pattern (bullish reversal pattern) on the daily chart and the breakout was supported by the higher volumes. After the breakout of the pattern, it witnessed an almost ~43% rise in the price in 8 days . The volume confirmed the price action and provided strength to the trend reversal.
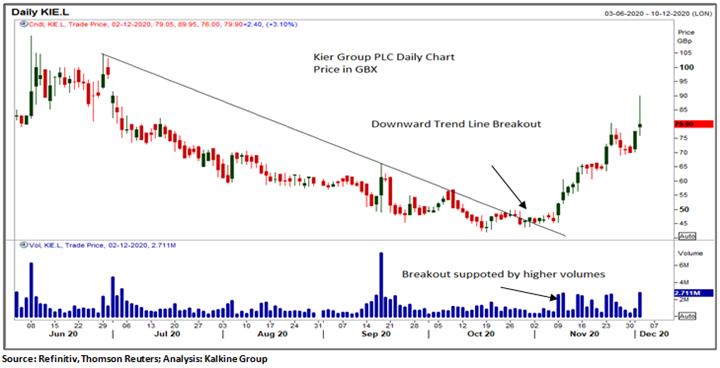
Another example is Kier Group PLC (LON:KIE), this shows the importance of volume in the trend line breakout. Trend line breakout signifies the reversal of the trend and must be accompanied by higher volumes for better results. As can be seen in the chart below, KIE broke the downward trend line and simultaneously there was an increase in the volumes as well, confirming the trend reversal. After the trend line breakout with the higher volumes, the prices almost doubled in the one month tenure.
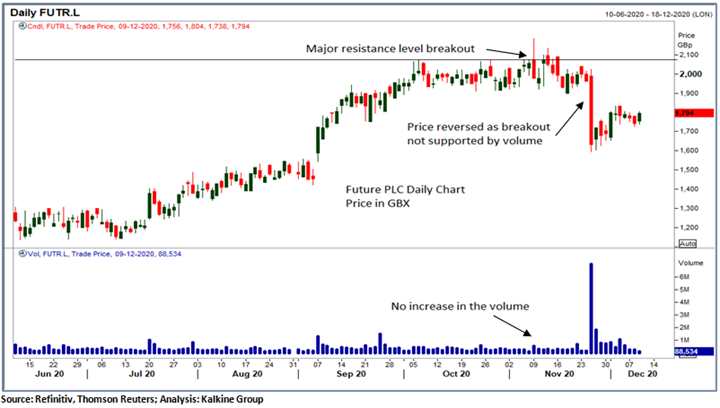
Our last example is of Future PLC (LON:FUTR) to show the importance of volume in the breakout. FUTR's prices broke the major resistance on the daily chart but the breakout was not supported by the volume (can be seen from the below chart). Prices were unable to sustain on higher levels and we saw sharp selling in it due to lack of volume at the time of breakout.
Volume indicates interest of the market participants in the stock and our above examples clearly explain the importance of volume in technical analysis. There are some technical indicators as well, based on volume as the key factor in the calculation methodology and measures the strength of volume in stock movement. Two mostly used indicators are, On Balance Volume (OBV) and Chaikin Money Flow.
- On Balance Volume (OBV):On Balance Volume (OBV) is one of the simplest and powerful volume indicators. It measures cumulative buying and selling pressure in stocks and uses it in conjunction with price for a meaningful trend analysis.
OBV should be in the same direction as price action to confirm the trend. If prices are going upside, then OBV should also move upside to confirm the trend or vice versa. Any opposite move in OBV in comparison to price shows the divergence that may lead to a probable reversal of the trend.
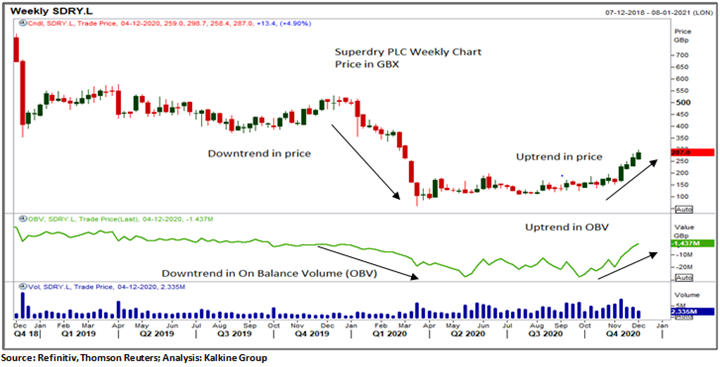
Following is the example of Superdry PLC (LON:SDRY) to show the importance of OBV. It can be analyzed from the chart that OBV also moved downward when prices fell and moved upward while prices increased and thus confirmed the price action.
- Chaikin Money Flow: Chaikin Money Flow is a volume oscillator that fluctuates above/ below the centerline and is calculated based on Money Flow Multiplier. It forms an accumulation/ distribution line that helps in trend confirmation or reversal.
A move above the centerline (zero value) indicates buying pressure in the stock while a move below the centerline (zero value) indicates selling pressure in the stock. Any divergence between the price trend and the Chaikin Money Flow direction indicates a possible reversal of the trend.
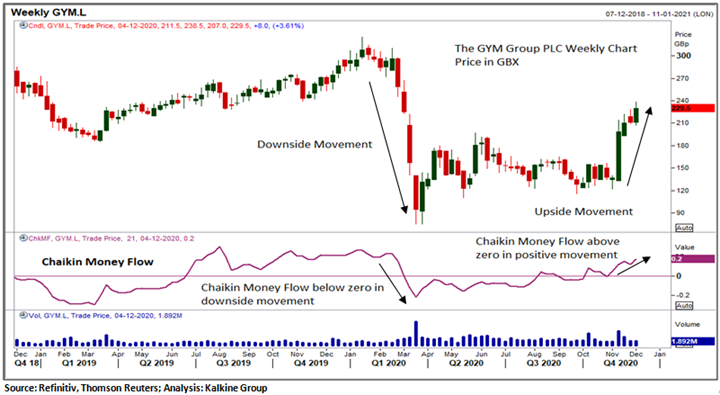
Following is the example of the GYM Group PLC (LON:GYM) to gauge the importance of Chaikin Money Flow. It can be witnessed from the chart that Chaikin Money Flow moved below the centerline in a negative zone when prices fell and moved above the centerline in a positive zone when prices increased and thus confirmed the price action.
Bottom Line:
Volume is a prominent tool to confirm the strength of a trend or indicating possible reversal, and it is implicit from the above examples as well. Using Volume with the price action and other technical indicators could provide better results and ignoring it in the technical analysis process may result in adverse results. It is important to focus on volume but only emphasizing it and ignoring the price action is never advisable.
