


_10_04_2024_16_38_50_427275.jpg)


Summary
- Stocks of Equitable Group have rebounded by over 103 per cent since the pandemic led market crash on March 24.
- Tucows’ stock has swelled by 25.85 per cent year-to-date.
- Both these stocks have posted high price gains in the past 30 days across the Toronto Stock Exchange (TSX) and TSX-Venture (TSXV).
Midcap stocks with good price performance have often lured investors. In the current scenario of Covid-19 pandemic and economic recovery, tech software and banking are two industries that are up and coming. We look at two midcap stocks from tech and financial services: Equitable Group Inc. (TSX:EQB) & Tucows (TSX:TC). Both the stocks have also announced their third-quarter earnings recently. These stocks are also a part of TMX’s ‘Price Performer’ list for posting high price gains in the past 30 days across the Toronto Stock Exchange (TSX) and TSX-Venture (TSXV) stocks.
Without wasting more time, let us delve into their stock and financial performance.
Equitable Group (TSX:EQB)
Toronto-based Equitable Group Inc’s stock has soared by nearly 41 per cent in the last six months.
The group operates its business through its subsidiary Equitable Bank, which provides single-family lending services in investment properties, commercial lending services, securitization financing, and deposit services. It also owns a digital bank under the EQ Bank brand. The company serves across Canada, with most of the mortgage principal coming from Ontario, Alberta, and Quebec.
Equitable Group recently set all-time high quarterly earnings during its third quarter ended September 30, 2020. The lender reported a substantial increase in its use of EQ Bank's digital banking services and led by deposits for its digital platform to C$ 4.3 billion. The company’s monthly average of account openings for Q3 2020 was over three times the average of 12 months before the COVID-19 pandemic.
Equitable Group posted expenses and write-offs of C$ 2 million or 3 basis points of total loan assets annualized.
The company’s adjusted earnings price share surged 30 per cent to C$ 4.13 from C$ 3.17 in Q3 2019. The adjusted return on shareholders' equity (ROE) of 19 per cent in Q3 2020, an increase of 16.2 per cent compared to Q3 2019.
Equitable stock has rebounded over 103 per cent since the pandemic led market crash on March 24. The lender has gained over 16 per cent in the last three months.
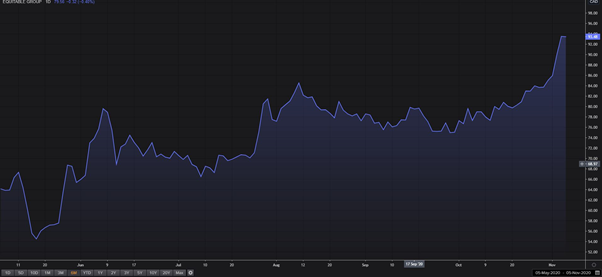
Equitable's Six-Month Stock Performance Chart. (Source: EODHD/Others Thomson Reuters)
Its current market capitalization stands at C$ 1.571 billion.
As per TMX data, Equitable’s price-to-book (P/B) ratio is 1.101, and the price-to-cash flow (P/CF) ratio is 3.70. The company provides a positive return on equity (ROE) of 13.61 per cent, and positive return on assets (ROA) of 0.66 per cent. The bank’s total debt-to-earnings ratio is 0.36. Its current price-to-earnings ratio is 8.20.
The financial company maintains a current dividend yield of 1.583 per cent. It pays a quarterly dividend of C$0.37 per share. The dividend growth for three-year is 13.75 per cent.
Equitable Group Inc. has also been ranked on TMX’s top financial services stocks that have outperformed their peers and the markets (TSXV and TSX) in the last 30 days.
Tucows Inc (TSX:TC)
Tucows Inc offers wholesale digital products to internet service providers and web hosting enterprises in the United States, Canada and Germany. It has two verticals in the technology sector: Domain Services and Network Access. The company generates most of its revenue from Domain Services.
The stock has swelled by 25.85 per cent year-to-date. In the last six months, shares of Tucows have surged by 26.93 per cent. The software stock has increased by 16.32 per cent in the last three months. Its current market cap is C$ 1.063 billion.
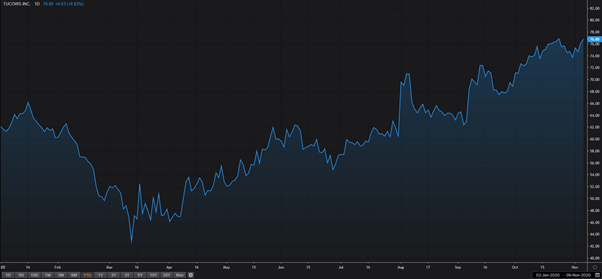
Tucows' Year-To-Date Stock Performance Chart / (Source: EODHD/Others Thomson Reuters)
As per the TMX website, Tucows’ price-to-book (P/B) ratio is 8.11, and the price-to-cash flow (P/CF) ratio is 16.90. The domain provider offers a positive return on equity (ROE) of 14.16 per cent, and a positive return on assets (ROA) of 3.05 per cent. The bank’s total debt-to-earnings ratio is 1.28. Its current price-to-earnings ratio is 8.20.
Tucows is a part of TMX’s top technology stocks that have outperformed their peers and the markets (TSXV and TSX) in the last 30 days. The tech company has also been placed on TMX’s top price performer stocklist that has stocks that have the largest price gains in the last 30 days.
The company reported an adjusted EBITDA of US$ 13.3 million for the third quarter of 2020 compared with US$ 14.8 million for the third quarter of 2019. The software company posted cash and cash equivalents of US$ 10.2 million at the end of Q3 of 2020 compared with US$ 8.9 million in Q2 of 2020.
