


Highlights
- GoldMining trades in mineral exploration sector across the Americas
- Recent trading shows slight decline with increased share activity
- Company operates multiple projects in Colombia, Brazil, United States, and Canada
GoldMining operates in the mineral exploration sector with a primary focus on acquiring and developing gold and copper projects across the Americas. The company’s portfolio includes La Mina Gold and Titiribi Gold-Copper projects in Colombia.
Whistler Gold-Copper Project in Alaska, Sao Jorge Gold Project in Brazil, and Yellowknife Gold Project in Canada. These projects emphasize a commitment to exploration and development of valuable mineral resources across multiple jurisdictions. The company’s operational scope provides exposure to varied geological formations and regions with significant mineral potential.
The company’s trading performance indicates modest fluctuations, reflecting a broader engagement in commodity-driven markets. During mid-day trading, GoldMining (TSX:GOLD) experienced a minor decline, with share activity surpassing the typical daily session, signaling heightened market participation. These fluctuations are common in smallcap indices and reflect market reactions to sector trends. The TSX Smallcap Index provides a relevant context for understanding the broader environment in which GoldMining operates.
Financial metrics offer insight into the company's stability and operational leverage. GoldMining has a debt-to-equity ratio indicating moderate reliance on external financing. The quick ratio, which measures short-term liquidity without inventory, is comparatively lower, while the current ratio remains strong, suggesting a capacity to manage obligations with current assets. The company's market capitalization reflects its positioning within the sector and signals the scale of operational activity.
Earnings data from the latest quarter indicated a neutral result per share, while market projections for the year suggest a slightly negative return per share. This outcome aligns with expectations for exploration-focused entities that prioritize project development over immediate profitability. The company’s beta signifies higher volatility relative to broader market trends, consistent with mining and resource-oriented equities.
How GoldMining Operational Areas Expand
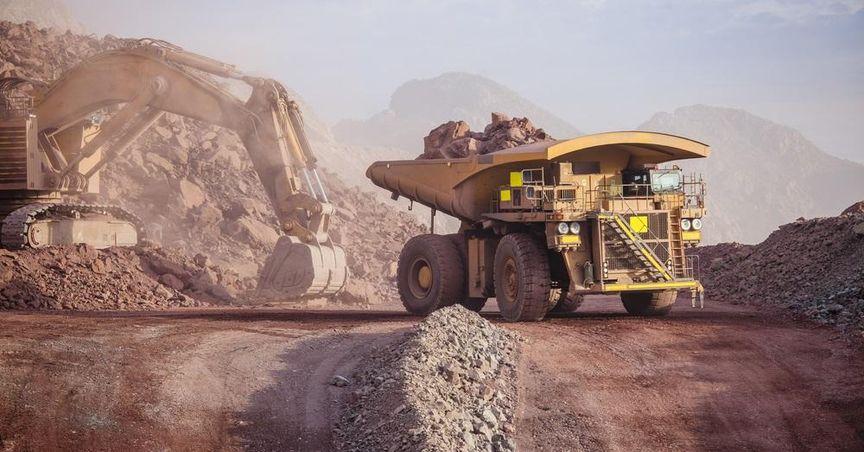
GoldMining’s (TSX:GOLD) geographical footprint spans multiple countries, providing diverse project exposure. In Colombia, the La Mina Gold and Titiribi Gold-Copper projects highlight mineral potential and the ability to access rich mining zones. The Whistler Gold-Copper Project in Alaska represents North American expansion with geological formations conducive to resource exploration. Brazil hosts the Sao Jorge Gold Project, emphasizing mineral resource development in South America, while Canada’s Yellowknife Gold Project reinforces domestic exploration capabilities.
Project locations reflect a strategy of regional diversification to mitigate operational concentration risks. Exploration activities include both preliminary and advanced-stage operations, integrating geological mapping, sampling, and feasibility assessments. These steps support long-term project viability and align with sector norms for exploration-driven enterprises. Operational updates focus on resource acquisition, development milestones, and regulatory compliance.
The company's share activity correlates with operational announcements and sector movements. Mid-day trading spikes often reflect shifts in market attention, potentially due to updates in project developments or broader commodities trends. These trading patterns are important for stakeholders tracking sector dynamics within the TSX Smallcap Index.
What Financial Ratios Reveal About Company
Financial indicators provide an overview of GoldMining (TSX:GOLD)'s operational health. The debt-to-equity ratio suggests a measured reliance on external financing, a critical factor for exploration-focused firms. A strong current ratio indicates capacity to meet short-term obligations, enhancing operational resilience. In contrast, the quick ratio remains lower, highlighting that liquidity without inventory is limited, a factor relevant for sector comparisons.
Market capitalization situates GoldMining among mid-tier mineral exploration companies within the Canadian market. Beta values suggest higher volatility than broader indices, consistent with resource-focused equities. Price movement relative to moving averages indicates trading patterns, with short-term averages showing proximity to recent market performance while longer-term averages reflect historical valuation trends.
Earnings reports demonstrate the company’s operational priorities, emphasizing project advancement over immediate returns. Quarterly results indicate neutral earnings per share, while full-year expectations show a slight decline per share. Such figures are typical for entities in early or development-stage exploration phases, where financial performance is often secondary to project milestones.
Why Trading Volume Matters For GoldMining
Trading volume provides insights into market engagement and liquidity. GoldMining has experienced fluctuations in share activity, with recent sessions exceeding typical averages. This indicates periods of higher attention and transaction activity, relevant for market participants tracking sector trends. Volume spikes often correspond with operational news, commodity price shifts, or broader market movements impacting mining equities.
Monitoring average session volumes alongside price trends helps identify periods of increased market participation. For companies like GoldMining, trading volume can reflect market perception of project updates or sector-wide developments in gold and copper exploration.
How Market Capitalization Reflects Company Size
GoldMining’s market capitalization serves as an indicator of the company's scale and sector positioning. The figure reflects cumulative valuation based on share count and trading levels, offering context for comparing GoldMining to other exploration-focused entities. Medium-cap companies like GoldMining occupy a space between smaller speculative projects and larger established mining enterprises, providing insight into operational scope and market presence.
The company’s capitalization interacts with market liquidity, trading volume, and sector dynamics. Comparisons with the TSX Smallcap Index allow for contextual assessment of relative scale and trading behavior.
What Earnings Information Indicates About Performance
Earnings per share data provides clarity on operational outcomes. GoldMining’s neutral quarterly earnings align with expectations for a company prioritizing project development over immediate financial returns. Negative full-year projections per share are consistent with exploration-stage enterprises that require sustained investment in resource development. These figures illustrate the focus on growth and project advancement, rather than immediate financial profitability.
Earnings outcomes are closely monitored alongside operational updates. For exploration companies, financial results often complement updates on project milestones, permitting a comprehensive view of company activity.
Where Geographical Projects Are Located
GoldMining (TSX:GOLD) maintains projects across Colombia, Brazil, United States, and Canada. La Mina Gold and Titiribi Gold-Copper projects in Colombia highlight resource-rich areas within South America. The Whistler Gold-Copper Project in Alaska provides access to North American geological formations. The Sao Jorge Gold Project in Brazil represents a strategic South American asset, while Canada’s Yellowknife Gold Project reinforces domestic exploration.
Geographical diversity supports risk management by reducing concentration in any single jurisdiction. Project location selection considers mineral potential, regulatory environment, and operational feasibility. This approach aligns with sector standards for exploration-focused companies managing multi-region assets.
How Beta Values Affect Market Behavior
GoldMining’s beta indicates heightened sensitivity to market fluctuations. A beta above one reflects stronger reactions to general market trends, consistent with commodity-focused equities. Companies in the mineral exploration sector frequently display elevated beta values due to dependency on commodity cycles and broader economic conditions. Understanding beta is essential for assessing market volatility and the relative movement of company shares compared to major indices.
Why Short-Term Moving Average Matters
Short-term moving averages provide insight into recent trading behavior. GoldMining’s current short-term average approximates mid-day trading levels, offering a lens into recent performance trends. These averages help contextualize price changes against historical data, useful for tracking trading momentum within the sector.
What Long-Term Moving Average Indicates
Long-term moving averages reflect historical pricing trends over extended periods. GoldMining’s long-term average is below recent trading levels, indicating a broader upward adjustment over time. Comparisons between short- and long-term averages help illustrate stability and market shifts over varying timeframes.
How Debt-To-Equity Influences Stability
The debt-to-equity ratio highlights leverage and capital structure. GoldMining’s (TSX:GOLD) moderate ratio suggests a balanced reliance on debt versus equity financing. For exploration-focused companies, managing debt levels is critical for funding operational growth while maintaining financial stability.
What Current Ratio Shows About Liquidity
Current ratio reflects the company’s ability to meet short-term obligations using current assets. GoldMining maintains a robust current ratio, indicative of adequate operational liquidity. High ratios signal the capacity to manage immediate liabilities, supporting project continuity and operational stability.
