


Funds with investments into commercial properties such as offices, factories, warehouses and retail spaces are referred to as âProperty Fundsâ. The lump-sum investments made by customers are polled together by Property Funds to purchase a range of assets in two ways- either directly investing in commercial property or indirectly, by buying shares in real estate companies or other property funds.
As stated in recent reports by market experts, the listed real estate investment trusts (REITs) and also unlisted property funds for individual investors have generated stellar returns in the financial year 2019 (FY19), performing better than the Australian equities market or the direct property investments.
Both listed real estate stocks and unlisted retail property funds have delivered over 13% return over the financial year 2019.
Some of the unlisted property funds include Australian Unity, Centuria Property Funds, and Folkestone Funds Management Group. Letâs look at how the past one year has been for the following listed Real Estate companies in Australia.
-
Goodman Group
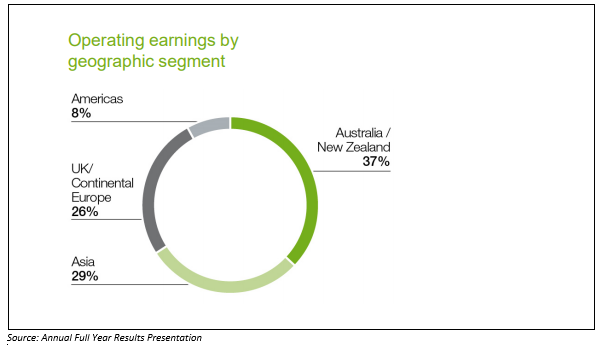
Goodman Group (ASX: GMG) is one of the largest integrated property groups comprising the stapled entities Goodman Limited, Goodman Industrial Trust and Goodman Logistics (HK) Limited. It is a specialist investment manager of industrial property and business spaces, globally, with operations spanning across Continental Europe, Australia, New Zealand, Asia, United Kingdom, North America and Brazil. (Assets under management: $ 46.2 billion)
Goodman Groupâs market cap is around $ 25.01 billion with ~ 1.83 billion shares outstanding. On 9 Sep 2019 (AEST 12:19 PM), the GMG stock was trading at a price of $ 13.850, up 1.243% with ~ 2.42 million shares traded. GMG has delivered an impressive positive return of 28.09% YTD, 4.51% in the last six months and 30.16% in the last one year.
On 23 August 2019, Goodman Group announced its results for the full year to 30 June 2019 (FY19), posting an operating profit of $ 942 million, up 11.4% on FY18, and operating earnings per share (EPS) of 51.6 cents, up 10.5% on FY18.
The statutory profit also increased by 48% to $ 1.628 billion. Going forth, the group forecasts to deliver FY20 operating profit of $ 1.040 billion (up 10.4%) and operating EPS of 56.3 cents (up 9% on FY19).
-
Scentre Group
Sydney-based Scentre Group (ASX: SCG), is the well-known owner and operator of Westfield Living Centres, housing ~11,500 outlets, valued at over $ 54 billion in Australia and New Zealand (ANZ). The Group also develops, owns and operates other retail real estate properties and shopping centres across Australia and New Zealand while also being responsible for asset management and marketing of the same.
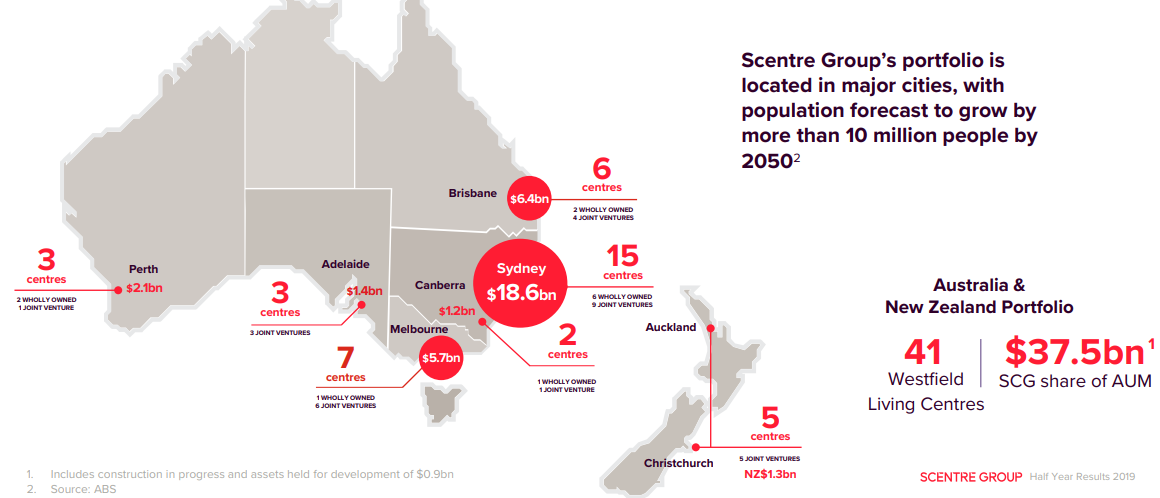
Scentre Group Portfolio (Source: Half Year Results Announcement and Slide Presentation)
Scentre Groupâs market cap is around $ 21.16 billion with ~ 5.32 billion shares outstanding. On 9 Sep 2019 (AEST 12:30 PM), the SCG stock price was trading at a price of $ 4.000, up 0.503% with ~ 1.62 million shares traded. In addition, SCG has delivered positive returns of 3.65% YTD.
For the half year ended 30 June 2019, the Group generated over $ 24 billion of annual retail in-store sales in ANZ and had more than 535 million annual customer visitations. The statutory profit amounted to $ 740.0 million and the Funds from Operations (FFO) per security increased by 3% to 12.75 cents per security.
-
Dexus
Dexus (ASX: DXS) is one of the leading property groups in Australia, managing a $ 31.8-billion high-quality portfolio of real estate assets. The Group directly owns ~$ 15.6 billion of office and industrial properties; while it also manages retail, office, healthcare and industrial assets for third party clients that are all valued at around $ 16.2 billion. Moreover, the groupâs ~$ 9.3-billion development and concept pipeline provide the opportunity to grow both portfolios and enhance future returns. (Assets Under Management: $ 31.8 billion)
Dexus has a market capitalisation of ~ $ 13.85 billion with ~ 1.1 billion shares outstanding. On 9 Sep 2019 (AEST 12:36 PM), the DXS stock was trading at a price of $ 12.685, up 0.435% by $ 0.055 with ~534,839 million shares traded. In addition, DXS has delivered positive returns of 20.06% year-to-date and 17.60% in the last one year.
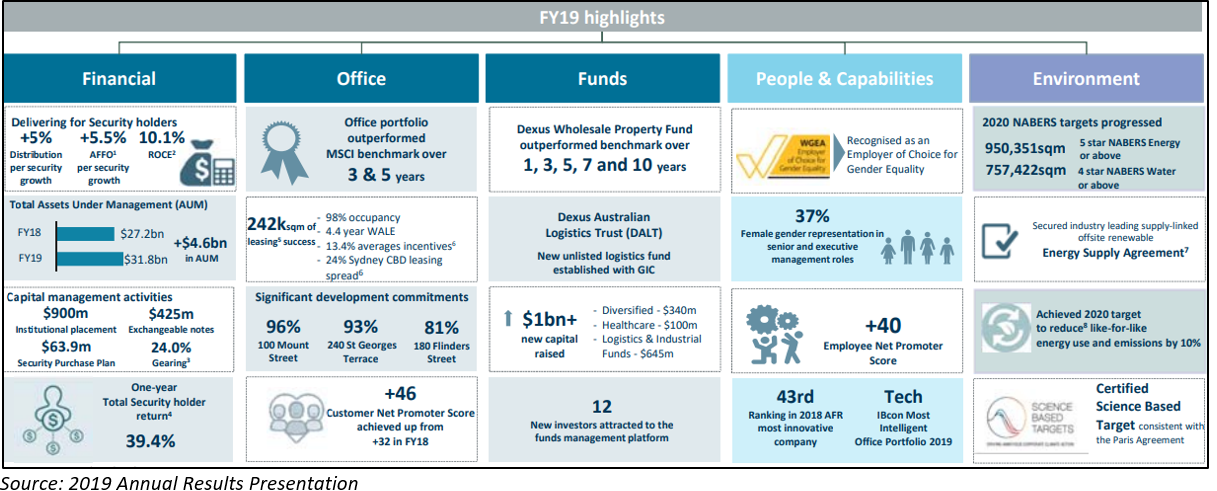
For the financial year ended 30 June 2019 (FY19), the Group achieved 5.5% Adjusted Funds from Operations (AFFO) per security growth and 5.0% distribution per security growth. The net profit after tax of $ 1.28 billion was down 25.9%, primarily due to net revaluation gains of investment properties being lower than those recognised in FY18. Dexus secured $ 3.1 billion of quality acquisition opportunities during the year and the office portfolio continued to outperform the MSCI office benchmark.
-
Mirvac Group
Mirvac Group (ASX: MGR) is a leading, diversified, Australian property group, with an integrated development and asset management capability. The Groupâs purpose is to Reimagine Urban Life in Australia. (Assets under management: $ 18 billion)
With a market capitalisation of ~ $ 12.08 billion and ~ 3.93 billion outstanding shares, the MGR stock was trading at a price $ 3.090 on 9 Sep 2019 (AEST 12:41 PM), up 0.651% by $ 0.020 with ~ 2.61 million shares traded. In addition, the stock has delivered positive returns of 39.55% YTD and 15.41% in the last six months.
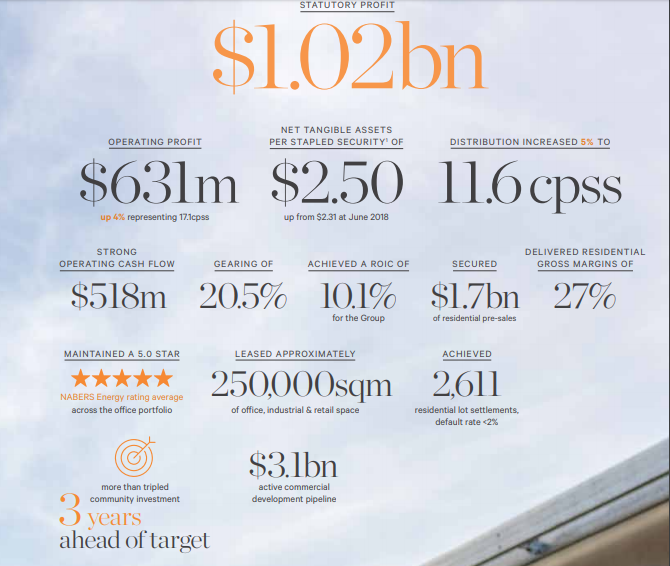 Source: Annual Report 2019
As per the full year results for the financial year ended 30 June 2019 (FY19), Mirvac Group reported a statutory profit of over $ 1 billion, marking the fourth consecutive year of profits consistent with the top end of the prescribed FY19 guidance. The earnings per share (EPS) of 17.1 cents per stapled security (cpss) increased by 4% along with distribution per share (DPS) increasing by 5% to 11.6 cpss as compared to the prior year of FY18.
During the concerned year, the Group also completed around 250,000 m2 of leasing across its investment portfolio, while the occupancy continued to be high at 99.0% with a WALE of 5.7 years. The Group also added that its young and low capex portfolio of assets is quite favoured specifically by the high calibre customers who prefer long-lease periods.
Also Read: Whatâs latest In REIT Space? A look At Three Real Estate Stocks
Disclaimer
This website is a service of Kalkine Media Pty. Ltd. A.C.N. 629 651 672. The website has been prepared for informational purposes only and is not intended to be used as a complete source of information on any particular company. Kalkine Media does not in any way endorse or recommend individuals, products or services that may be discussed on this site. Our publications are NOT a solicitation or recommendation to buy, sell or hold. We are neither licensed nor qualified to provide investment advice.
