
 AUS
AUS
 NZ
NZ
 UK
UK
 CA
CA
 USA
USA
 IND
IND





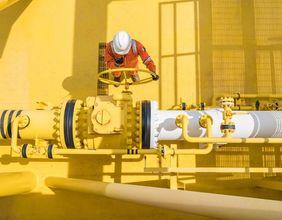

Global demand for iron ore is expected to rebound in the coming months, underpinned by cooling-off of macros concerns. Two important players in the iron ore space are BHP Group Limited (ASX:BHP) and Fortescue Metals Group Ltd (ASX:FMG). Letâs see how the recent developments in these companies are affecting their stock prices.
BHP Group Limited (ASX:BHP)
BHP Group Limited (ASX:BHP) is a global producer of major commodities, such as copper, iron ore and metallurgical coal.
Update to Dividend Distribution: Recently, the company provided an update to the market regarding its dividend distribution, due to update to Appendix 3A.1 released on 10 September 2019. The dividend (fully franked) of USD 0.780 (related to a period of six months to 30 June 2019), had record date, ex-date and payment date on September 6, 2019, September 5, 2019 and September 25, 2019, respectively.
Interim Dividend Dates: In another update, the company provided proposed dates for the Interim Dividend for the year 2020 of BHP Group Plc and BHP Group Limited, with the DRP (Dividend Reinvestment Plan) expected to operate with respect to the interim dividend for the year 2020.
As per the release, BHP Group is expected to announce half yearly results and dividend determination on 18 February 2020 and currency conversion into RAND on 28 February 2020, while last day to trade cum dividend on JSE is anticipated on 3 March 2020.
Additionally,
- Ex-Dividend Date (JSE) would be on 4 March 2020;
- Ex-Dividend Date (ASX, LSE and NYSE) on 5 March 2020;
- Record Date on 6 March 2020; and DRP and Currency Election date (including announcement of currency conversion for ASX and LSE) on 9 March 2020;
- Payment date is expected on 24 March 2020;
- DRP Allocation Date (ASX and LSE) within 10 business days after the payment date on 7 April 2020;
- DRP Allocation Date (JSE), subject to the purchase of shares by the Transfer Secretaries in the open market (CSDP accounts credited/updated on or about) on 7 April 2020.
FY19 Key Highlights for the year ended June 30, 2019:
- Revenue from continuing operations for the period was reported at US$44,288 Mn, which is an increase of 3% over previous year.
- Revenue from discontinued operations for FY19 stood at US$851 Mn, representing a decrease of 61% from the same period a year ago.
- Total revenue for the period remained flat as compared to previous year at US$45,139 Mn.
- Profit from continuing operations (after taxation) which belongs to the BHP Group members was reported at US$8.65 Bn, up 30% year-on-year.
- Loss from discontinued operations (after taxation) which belongs to the members of the BHP Group stood at US$342 Mn, which is an increase of 88% on previous year.
- The combined profit after taxation belonging to the BHP Group members was reported at US$8.31 Bn, up 124% on previous year.
- Net tangible assets per share for the period was reported at US$10.11, as compared to US$11.25 on the previous year.
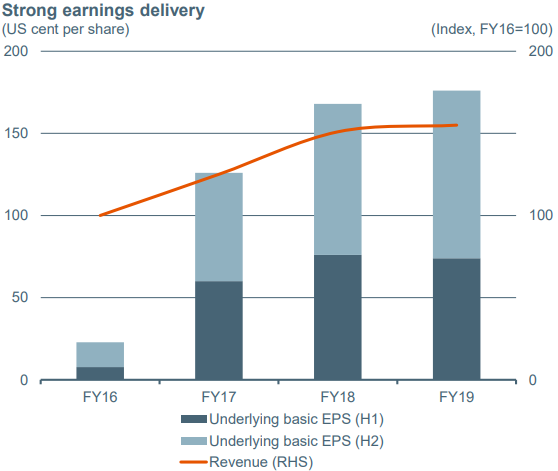
FY19 Key Financial Metrics (Source: Company Reports)
On the stock information front: On October 8, 2019 (AEST 01:28 PM), the stock of BHP was trading at A$35.630, up 0.707%, with a market cap of ~A$104.22 Bn. Its current Price to Earnings multiple was reported at 15.480x and its last Earnings Per Share was noted at A$2.286. The stockâs 52 weeks high level was reported at A$42.330 and 52-weeks low level was reported at A$29.062. The stock has delivered a one-year absolute return of 6.96%, whereas its six months and three months return stood at -11.81% and -12.77%, respectively.
Fortescue Metals Group Ltd (ASX:FMG)
Fortescue Metals Group Ltd (ASX:FMG) is involved in the exploration, development, production, processing and sale of iron ore.
Recently, on October 4, 2019, the company gave an update to the market regarding its dividend distribution for the 12-month period to June 30, 2019. FMG announced the update due to DRP pricing allocation, with dividend scheduled for payment on October 2, 2019. Recently, one of the companyâs director Jennifer Morris acquired 315 ordinary shares at a value of $2,771.30, taking the final holdings to 11834 ordinary shares, effective from October 2, 2019.
In another update, the company announced successful refinancing and replacement of its US$1.4 Bn 2022 syndicated term loan facility (term loan) through repayment of US$800 Mn, which will be paid from the proceeds from the issue of US$600 Mn senior secured note and US$200 Mn from available cash. It also involves expansion of US$600 Mn term loan balance to 2025 on the same terms and conditions.
FY19 Key Highlights for the year ended June 30, 2019: The company reported record annual safety performance with a Total Recordable Injury Frequency Rate (TRIFR) of 2.8, which is a 24% improvement on comparison to the previous year. Ore shipped during the period was reported at 167.7 Mn tonnes, which is 1% lower than FY18.
Average revenue received for FY19 stood at US$65 per dry metric tonne (dmt), up 48% from the same period a year ago. C1 costs for the period was reported at US$13.11 per wet metric tonne (wmt).
FY19 revenue stood at US$9,965 million, owing to factors such as
- Growing demand for the companyâs products after the moderation of steel mill margins and narrowing of price spreads in China from late 2018;
- Success of the integrated operations and marketing strategy, boosting the volume of higher value products that were shipped (including West Pilbara Fines);
- Sustained strength in the benchmark iron ore price following supply disruptions in Brazil and Australia in the first quarter of 2019, owing to which significant drawdowns in iron ore inventories were reported at Chinese ports;
- Continued growth in steel production in China, which reported an increase of 9.9% year-on-year in the first half of CY19.
Underlying EBITDA for the period increased by 90% to more than US$6 Bn, as compared to previous year, while underlying NPAT went up by 195% to US$3.2 Bn. Earnings per share for the period was reported at US$1.03 (A$1.47 per share). The Board of Directors declared a final dividend (fully franked) of A$0.24 per share, taking total FY19 dividend to A$1.14, which is 78% pay-out of full year NPAT, an increase of 396% on the previous year (A$0.23 per share).
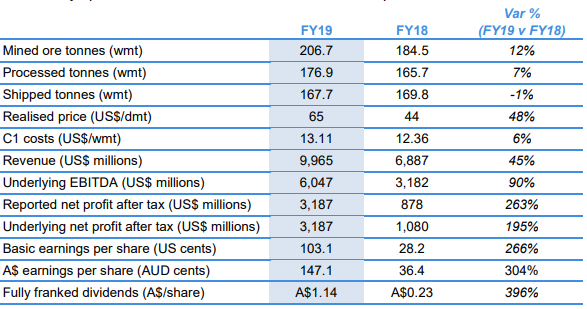
FY19 Key Financial Metrics (Source: Company Reports)
FY20 Guidance: For the financial year 2020, the company is expecting to report
- Shipments of 170-175 metric tonnes (including 17-20 metric tonnes of West Pilbara Fines product)
- C1 costs in the range of US$13.25-13.75/wmt
- Average strip ratio at 1.5
- Total capital expenditure for FY20 has been estimated at US$2.4 Bn
- Depreciation and Amortisation expense has been estimated at US$7.70/wmt
Total capital expenditure would include US$700 Mn under sustaining capital; US$200 Mn under operational development; US$150 Mn under Queens Valley development; exploration costs at US$140 Mn; and costs for major projects at US$1200 Mn (Eliwana - US$700 Mn and Iron Bridge -US$500 Mn). A total dividend pay-out ratio is expected to be in the range of 50% and 80% of full year NPAT.
On the stock information front: On October 8, 2019 (AEST 01:31 PM), the stock of FMG was trading at A$8.790, down 1.347%, with a market cap of ~A$27.43 Bn. Its current Price to Earnings multiple was reported at 6.06x and its last Earnings Per Share was noted at A$1.470. The stockâs 52 weeks high level was reported at A$9.550 and 52 weeks low level was reported at A$3.256, respectively. The stock has delivered a one-year absolute return of 169.08%, whereas its six months and three months return stood at 19.33% and 0.68%, respectively.
Disclaimer This website is a service of Kalkine Media Pty. Ltd. A.C.N. 629 651 672. The website has been prepared for informational purposes only and is not intended to be used as a complete source of information on any particular company. Kalkine Media does not in any way endorse or recommend individuals, products or services that may be discussed on this site. Our publications are NOT a solicitation or recommendation to buy, sell or hold. We are neither licensed nor qualified to provide investment advice.
