


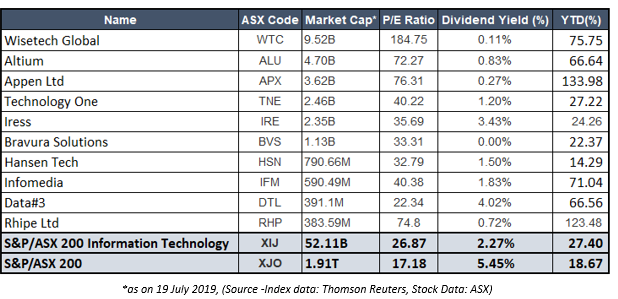
The benchmark index ASX 200 has had a good 2019, with YTD returns of ~18.67 per cent as on 19 July 2019. During the same period, the Australian Information technology sector has out-performed ASX 200 by delivering a YTD returns of 27.40 per cent. However, the outperformance has also resulted in the IT index trading at a historic PE ratio of 26.87x as against the ASX 200âs PE ratio of 17.18x.
PE is a widely used relative valuation metric, which gives a quick pulse on the valuation of the business. The inverse of PE provides the earnings yield. The IT index is currently having an earnings yield of 3.8 per cent as against the S&P 200âs earnings yield of 5.81 per cent.
The dividend yield is also a useful metric to get a pulse on valuation. The ASX 200 is currently providing a dividend yield of 5.45 per cent as against the IT index, S&P/ASX 200 Information Technology, dividend yield of 2.27 per cent. Albeit, growth companies, usually are not known for paying out a dividend. Moreover, the S&P/ASX 200 Information Technology index is trading at a new 52-week high and trading in the uncharted territory. The IT index is trading at a stretched valuation when compared with the benchmark index.
Does the stretched valuation put the Information technology sector in bubble territory?
A bubble is a cycle where there is a rapid increase in the prices of the asset, followed by a sudden fall in its price. The bubble is created as a result of an increase in the asset price catalysed by a perceived improvement of the fundamentals of the asset, followed by mass participation in the price up rally irrespective of the underlying fundamentals. The prices of these asset increase to such an extent where buyers are not willing to buy more of that asset. Thus, they start selling off their assets on a huge scale, which results in bubble deflation. This situation leads to immense loss to the investors who have invested in these assets.
The most common and popular way to check if the stock is overvalued or not is by comparing the PE ratio to the stocks historical PE ratio. If the PE ratio is way above the average historical PE ratio, it is usually safe to assume that the stock is overvalued. Further, certain participants also consider the growth in stocks earnings and compare the growth rate with the PE. In this method, the investor calculates the P/E ratio of the stock and then compares it to the earnings growth rate. In case the PE ratio is above its growth rate, then it is concluded that the stock is overvalued.
In the table, as mentioned above, which contains 10 IT stocks, the reader can notice that majority of the stocks are trading above both, the sector index- S&P/ASX 200 Information Technology and the market benchmark index S&P/ASX 200âs PE ratio. Let us have a look at two major IT stocks that are trading at premium valuations.
WiseTech Global Limited
About the company: WiseTech Global Limited (ASX:WTC) is one of the leading developer as well as a provider of cloud-based software solutions to the logistics industry within and outside the country. Since 1994, the company has been continuously supported various logistics companies in managing the movement of their goods and information in an efficient manner. Through its flagship product CargoWise One, the company helps its clients in increasing productivity as well as improving integration, automation, as well as communication with the supply chain.
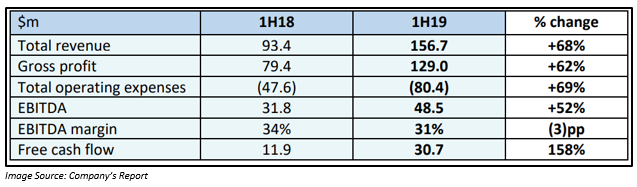
Companyâs Performance: In the 1H FY2019, the company reported strong growth of 68% in its revenue to $156.7 million as compared to its previous corresponding period. The operating profit increased by 59% to $35.9 million on pcp, and the net profit increased by 48% as compared to pcp. The company also reported a 43% growth in its EPS to 7.6 cents per share on pcp.
The company witnessed good traction in recurring revenue of around 89%, The flagship CargoWise One platform cargo wise recurring revenue was at 100%.
During the period, the organic revenue, which was generated through the existing and new clients contributed almost half of the total revenue of the company, which was driven by the continuous application of CargoWise One platform by the prevailing customer organisations, change of customer licensing to standard transaction-based licensing, revenue from the new products as well as features followed by new sales and surge in the usage by new clients.
Also, from FY2006 to FY2018, the revenue growth for CargoWise One was attained across all prevailing client partners. These factors create confidence amongst the investors in anticipation of a better return in the future, which boosts them to buy more stocks. As a result, it also influences the share price to surge up on ASX, thus a premium PE ratio. The stock is trading at a PE ratio of 183.77x and an annual dividend yield of 0.11%.
Stock Performance: WTC is trading at A$30.00, up by 0.234% as compared to its previous closing price (as at AEST 3:59, 19 July 2019). WTC has a market cap of 9.52 billion with approximately 318.18 million outstanding shares,
Appen Limited
About the Company: Appen Limited (ASX: APX) is another company from the information technology sector which provides high-quality training data for machine learning at scale.
The company has expertise in more than 180 languages and has more than 1 million trained contractors and latest AI-assisted data annotation platform.
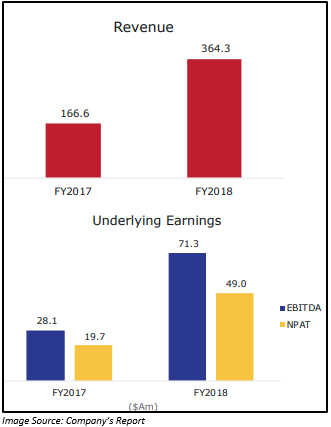
Companyâs Performance: The company reported a strong increase in its FY2018 revenue by 119% to $364 million. There was an increase in the Underlying EBITDA by 153% to $71.3 million and statutory EBITDA by 206% as compared to the previous corresponding period. An improvement was also seen in the underlying EBITDA margin from 16.9% to 19.6%. Solid growth in the underlying net profit after tax (NPAT) by 148% to $49.0 million as well as statutory NPAT by 192% to $41.7 million. The company declared a full-year dividend of 8 cents per share.
The revenue growth of 2H FY2018 over 1H FY2018 was 39% for language resource, which was pushed up by various technology sector projects. The company also reported high revenue growth and margin expansion for Content Relevance driven by prevailing and new customer investments in Artificial Intelligence.
The balance sheet of the company also witnessed a strong increase in the net asset base, which was the outcome of significant growth in the total asset of the company.
If we see the cash flow statement of the company, there was a significant increase in the operating cash inflows as compared to the previous corresponding year. The cash inflow through the receipt from the customer increased almost twice in FY2018. By the end of FY2018, APX had net cash and cash equivalent worth $40.045 million.
The company also made a transformative acquisition where the company acquired Figure Eight Technologies.
Outlook: The company has positioned itself well in the high growth market, with the core business also doing well.
The outstanding result in the past has attracted a lot of investors to the company. The stock is trading at a premium PE of 74.7x with the positives backed in. The company is trading at an annual dividend yield of 0.27%.
Stock Performance: At market close, on 19 July 2019, the shares were trading at A$30.120 up by 0.568% as compared to its previous close. APX has a market cap of 3.62 billion, with approximately 120.98 million outstanding shares.
Bitcoins: Apart from these stocks, Bitcoin has also gained a lot of attention from the investors, which is reflected in the price movement. Bitcoin is a cryptocurrency which acts as a medium of exchange and uses cryptography for its management. Bitcoin is popular amongst the investors as it allows users to send money across the globe to any place and at a minimum cost, the transaction is extremely secure since it uses encryption technology. Moreover, bitcoin has surged from the low levels of USD 3426.9 made in the early part of 2019 to a recent high price of USD 13,764, resulting in a 4x return.
Post, making a year high price of USD 13,764, bitcoin prices have cooled down to USD 10,622, as on 18 July 2019. At present scenario, buyers seem to be exhausted, and sellers have taken the driverâs seat. Many market veterans are of the view that Bitcoin prices are in a bubble, characterised by volatile price surges and drops.
Disclaimer
This website is a service of Kalkine Media Pty. Ltd. A.C.N. 629 651 672. The website has been prepared for informational purposes only and is not intended to be used as a complete source of information on any particular company. Kalkine Media does not in any way endorse or recommend individuals, products or services that may be discussed on this site. Our publications are NOT a solicitation or recommendation to buy, sell or hold. We are neither licensed nor qualified to provide investment advice.
