Highlights:
- The Vale S.A. (VALE) stock returned over 15% gains YTD.
- Barrick Gold’s (NYSE:GOLD) net income was US$706 million in Q1, FY22.
- Pfizer, Inc. (NYSE:PFE) revenue rose 77% YoY in Q1, FY22.
Stagflation is a period when inflation rises sharply amid an economic slowdown. The US had a similar experience between the 1970s and early 1980s.
At the time, higher oil prices, unemployment rate, and double-digit inflation wreaked havoc on the US economy. The S&P 500 index lost over half of its value in the period.
Although today the US unemployment is near its pre-pandemic low, inflation is at a four-decade high, and the GDP growth has slowed. In May, US CPI climbed to 8.6% annually, its highest increase since December 1981. The S&P 500 entered a bear market territory this week after a brutal sell-off. So, could it be early signs of stagflation in the US?
Here we explore five stocks that may help beat stagflation.
Also Read: OXY to LMT: 5 dividend stocks to explore as inflation scorches US
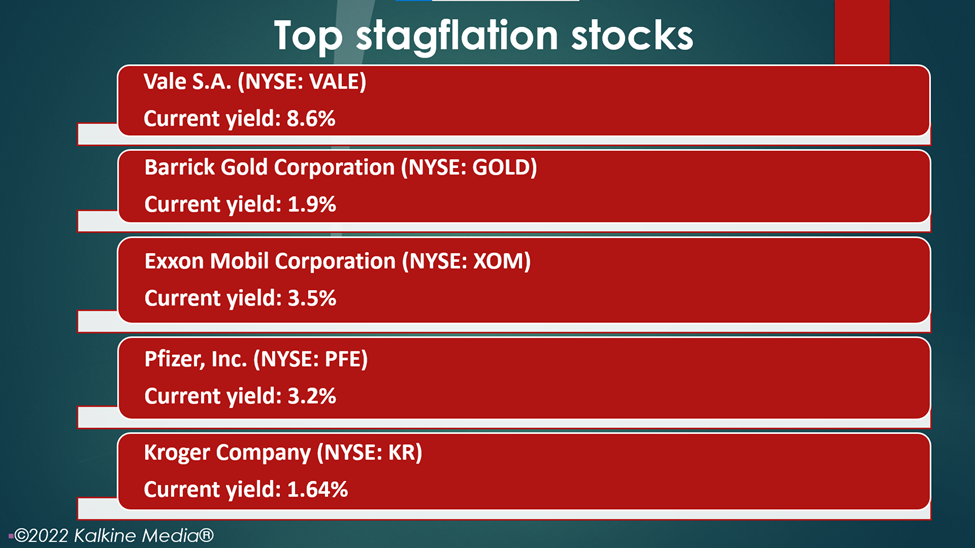
Vale S.A. (NYSE:VALE)
Vale SA is a metal and mining company based in Rio de Janeiro, Brazil.
Its shares traded at US$15.84 at 2:25 pm ET on June 14, down 0.30% from their previous close. Vale’s stock price rose over 15% YTD.
It has a market cap of US$74.94 billion, a P/E ratio of 3.72, and a forward one-year P/E ratio of 3.53. Its current yield is 8.6%, and its annualized dividend is US$1.45.
The 52-week highest and lowest stock prices were US$23.18 and US$11.16, respectively. Its trading volume was 46,922,040 on June 13.
The company posted net operating revenue of US$10.81 billion in Q1, FY22, compared to US$12.55 billion in the year-ago quarter. Its net income came in at US$4.48 billion, against an income of US$5.54 billion in Q1, FY21.
Also Read: What triggered FedEx (FDX) stock rally today?
 Source: Pixabay
Barrick Gold Corporation (NYSE:GOLD)
Barrick Gold is a mining company specializing in gold and copper exploration. It is based in Toronto, Canada.
The stock traded at US$19.40 at 2:30 pm ET on June 14, down 3.58% from its previous closing price. The GOLD stock rose 8.52% YTD.
Its market cap is US$34.58 billion, the P/E ratio is 17.83, and the forward one-year P/E ratio is 16.77. Its current yield is 1.9%, and its annualized dividend is US$0.40.
The stock touched a peak price of US$26.07 and the lowest price of US$17.27 in the last 52 weeks. Its share volume on June 13 was 26,792,010.
The company's revenue decreased by 3% YoY to US$2.85 billion in Q1, FY22. Its net income was US$706 million, compared to US$830 million in the year-ago quarter.
Also Read: Podcast audience skyrockets for AMZN, SPOT with billions in investment
Exxon Mobil Corporation (NYSE:XOM)
Exxon Mobil is an energy firm producing crude oil and natural gas.
Its shares traded at US$95.90 at 2:37 pm ET on June 14, up 0.05% from their closing price of June 13. Its stock value soared 50.85% YTD.
The firm has a market cap of US$405.73 billion, a P/E ratio of 15.97, and a forward one-year P/E ratio of 9.64. Its current yield is 3.5%, and its annualized dividend is US$3.52.
The 52-week highest and lowest stock prices were US$105.57 and US$52.10, respectively. Its trading volume was 33,421,050 on June 13.
The company's total revenue and other income were US$90.50 billion in Q1, FY22, compared to US$59.14 billion in the same quarter of the prior year. Its attributable net income was US$5.48 billion, against an income of US$2.73 billion in Q1, FY21.
Also Read: Can these 5 utility stocks weather inflation? DUK, SO, D, AEP & SRE
Pfizer, Inc. (NYSE:PFE)
Pfizer is a global pharmaceutical company based in New York. The company reaped significant profits from its Covid-19 vaccine sales.
The stock traded at US$47.751 at 2:41 pm ET on June 14, down 0.33% from its previous closing price. The PFE stock fell 15.43% YTD.
Its market cap is US$267.98 billion, the P/E ratio is 10.95, and the forward one-year P/E ratio is 7.24. Its current yield is 3.2%, and its annualized dividend is US$1.60.
The stock touched a peak price of US$61.71 and the lowest price of US$38.70 in the last 52 weeks. Its share volume on June 13 was 26,988,990.
The company's revenue rose 77% YoY to US$25.66 billion in Q1, FY22. It reported a net income of US$7.86 billion, or US$1.37 per diluted EPS, compared to US$4.87 billion, or US$0.86 per diluted share in Q1, FY21.
Also Read: HST to VTR: Should you explore these 5 REITs as inflation shoots up?

Kroger Company (NYSE:KR)
Kroger is a Cincinnati, Ohio-based departmental chain in the US. Although supply chain disruptions and higher freight costs have affected retail firms, the demand remains solid.
Its shares traded at US$50.42 at 2:45 pm ET on June 14, up 0.18% from their closing price of June 13. Its stock value jumped 11.37% YTD.
The firm has a market cap of US$36.37 billion, a P/E ratio of 23.15, and a forward one-year P/E ratio of 13.11. Its current yield is 1.64%, and its annualized dividend is US$0.84.
The 52-week highest and lowest stock prices were US$62.78 and US$36.77, respectively. Its trading volume was 5,447,447 on June 13.
The company will report its first-quarter fiscal 2022 earnings results on June 16, before the opening bell.
Meanwhile, in the fourth quarter of fiscal 2021, the company's sales were US$33.04 billion, compared to US$30.73 billion in the year-ago quarter. For the full fiscal 2021, its sales were US$137.88 billion.
Also Read: Is technology sector's decade-long market dominance fading?
Bottom line:
The S&P 500 index is down 21.33% YTD as of June 14. Investors should exercise due diligence before spending in the stock market.


