

_10_04_2024_16_38_50_427275.jpg)

Pure Gold is a Canadian based company which is focused on gold exploration. Pure Gold Mining Inc. was pleased to announce the launch of the Exploration Program 2019 at its fully owned Madsen Red Lake Gold Mine located in Red Lake, Ontario. The exploration program focusses on Wedge, Fork and Russet South sites; will take place in phases with the objective of transforming and optimizing the mineral resources. This will act as a foundation of the recently completed Preliminary Economic study of these resources.
 Drilling work has already re-started on the project with the first phase assimilating one diamond drill rig, focusing on the upgrading of the estimated resources at the Wedge, as well as testing along with its extensions.  The Fork extension, drilling work will be included in the initial testing. Surface work will be continued as a part of the Exploration program 2019 to prepare a further 24 current exploration sites (high priority) across the Madsen property for potential exploration and drilling. The Exploration program 2019 completion is expected by December.
At Wedge, drilling work of 8.3 metres, yielded gold of 33.3 grams per tonne from hole PG17-467. Another drilling work of 1.0 metre, yielded gold of 354.0 grams per tonne from hole PG18-540. Similarly, at Fork, drilling work of 3.0 metres, yielded gold of 104.1 grams per tonne from hole PG16-198.
The probable reserves at the Madsen Red Lake Gold Mine are valued at 1 million ounces of gold at an average grade of 9 gram per tonne contained within 3.5 million tonnes is one of the main highlights from Madsen Red Lake Feasibility Study. The initial investment required is of C$95 million plus C$8 million required as a contingency fund. In addition, access should be provided for plant and existing infrastructure and underground development. The expected Internal Rate of Return is 36 per cent with three years and four months breakeven period. The after-tax net present value discounted at 5 per cent level stood at C$247 million.
 There is a new chapter added in the successful journey of the Company as they commence trading on the London Stock Exchange alongside their existing listing in Toronto. The LSE listing will enable the United Kingdom/European investors to invest in Pure Gold as the company is looking forward to construction plan for their high-grade Madsen Red Lake Gold Mine and first batch of production planned for next year.
Financial Highlights - Three Months ended March 31, 2019 ($)
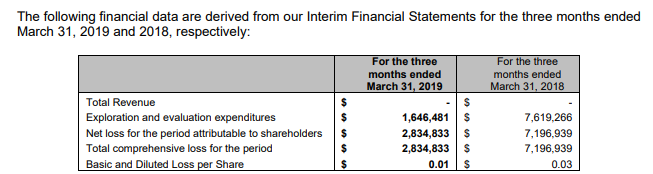
(Source: Quarterly Report, Company Website)
Net loss and comprehensive loss for the three months ended March 31, 2019, totalled at $2.8 million compared to $7.2 million for the same period in the previous year. The most important contributors to the loss for the period ended March 31, 2019, and 2018, were (a) exploration and evaluation expenditures, (b) share-based compensation, (c) wages, consulting and directors fees (d) investor relations and communication expenditures (e) office and rent expenses, (f) professional fees and (g) income tax recoveries.
Exploration and evaluation expenditure dipped to $1.6 million for the three months ended March 31, 2019, compared to $7.6 million for the same period in the prior year. The Companyâs exploration and development activities at Madsen during the three-month period ended March 31, 2019, included the completion of the feasibility study and PEA (Preliminary Economic Assessment) on the Russet South, Fork and Wedge deposits. During the three months ended March 31, 2019, the Company conducted a surface and underground drilling program in addition to conducting engineering studies associated with the feasibility study.
Professional fees surged to $0.2 million for Q1 FY2019 against $0.1 million for the same period in the previous year. Professional fees have increased as the Company engaged the financial advisors to evaluate its various strategic alternatives and identify and engage potential project finance partners.
Share-based compensation expense decreased to $0.1 million for the three months ended March 31, 2019, as compared to $0.3 million in the same period in the prior year, reflecting the fewer number of vesting options. Share-based compensation expense relates to grants from current and previous periods in which stock options were granted to directors, employees and consultants. The Company didnât announce any stock options during Q1 FY2019, or for Q1, FY2018. Stock options previously granted to employees and consultants were subject to vesting restrictions over a three-year period with the corresponding share-based compensation expense being recognized over this period.
Total assets increased by $3.4 million as at March 31, 2019 in comparison to December 31, 2018 primarily due to cash received from the 2019 Offering totalling $5.2 million, net of share issuance costs of $0.5 million, and stock option exercise proceeds of $0.7 million, partially offset by operating expenditures totalling $2.7 million. In addition, upon adoption of IFRS 16 on January 1, 2019, the Company recognized a right-of-use asset of $0.7 million regarding its head office lease.
Current liabilities increased by $1.0 million to $2.0 million at March 31, 2019 as compared to $1.0 million at December 31, 2018. Accounts payable and accrued liabilities remained consistent during the three-month period. The Company recognized a flow-through share premium liability of $0.9 million regarding the 2019 offering. Additionally, upon adoption of IFRS 16, the Company recognized a current lease liability of $0.1 million regarding its head office lease. Non-current liabilities increased by $0.7 million between December 31, 2018, and March 31, 2019 due to, upon adoption of IFRS 16, the recognition of the long-term portion of the Companyâs lease liability relating to its head office lease of $0.6 million, as well as a change in the discount rate used to calculate the Companyâs provision for closure and reclamation.
During the three months ended March 31, 2019, the Company issued 7,723,975 common shares pursuant to the 2019 Offering and 2,110,000 common shares upon the exercise of the employee, director, and consultant stock options with a weighted average exercise price of $0.34. The Company has not declared any dividends since incorporation.
Pure Gold Mining Inc Share Price Performance
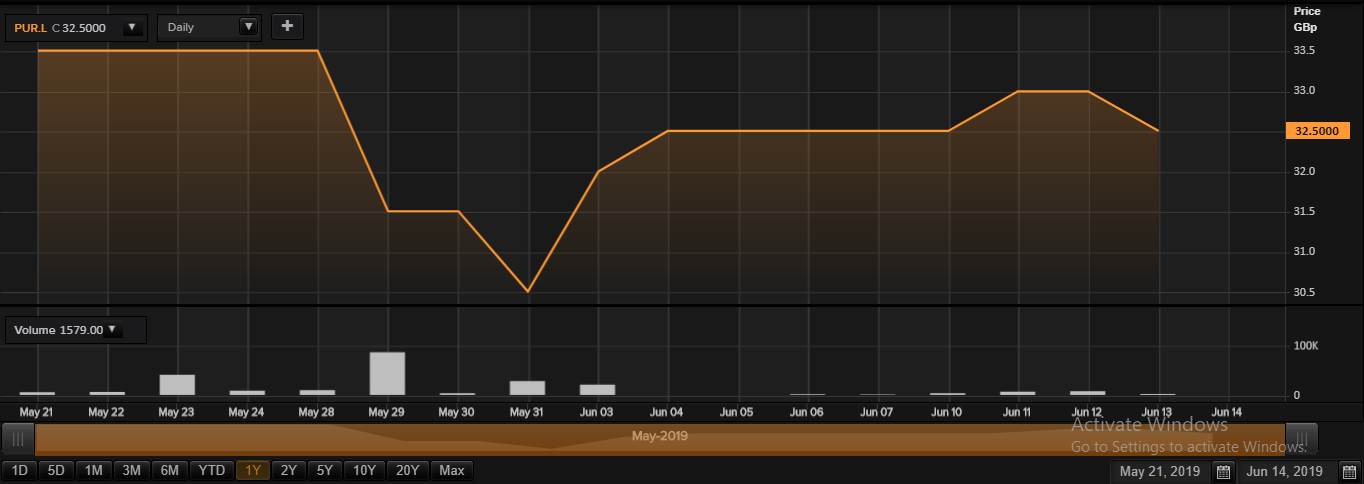
Daily Chart as at June-14-19, before the market closed (Source: Thomson Reuters)Â
At the time of writing (as on June 14, 2019, at 8:30 AM GMT), shares of Pure Gold Mining Inc were quoting at GBX 32.50 per share and remained flat against the yesterday's closing price level. The outstanding market capitalisation of the company stood at around £82.89 million. In the last 52-wks, shares of Pure Gold Mining Inc have registered a high of GBX 34.50 (as on Jun 12, 2019) and a low of GBX 30.00 (as on May 29, 2019). At the current trading level, as quoted in the price chart, its shares are trading near the 52wk high price level and 8.33 per cent above the 52wk low price level. However, the 5-day average daily volume traded in the stock was at 3,961.60. The companyâs stock beta was 1.48, reflecting significantly higher volatility as compared to the benc
