AUS
AUS
 NZ
NZ
 UK
UK
 CA
CA
 USA
USA
 IND
IND






The United Kingdom based Glencore PLC (LON:GLEN) has signed a MoU (Memorandum of Understanding) with the African-focused oil explorer, FAR Limited (ASX:FAR) regarding the full allocation of the Australian Companyâs share of crude oil from the Sangomar Field in Senegal.
The binding Memorandum of Understanding between Glencore PLC and FAR Ltd, will provide the African explorer with access to the extensive marketing channels and offtake resources of one of the worldâs leading marketers of crude oil; the MoU is subject to the negotiation of final documentation consistent with industry standards.
The Australian firm shall benefit from Glencoreâs global network and connections as well as multi-decades expertise in the oil and gas landscape. FAR Limited will be able to maximize the intrinsic value of the Sangomar barrels by leveraging the access it has to Glencoreâs unprecedented track record in successfully creating markets for new qualities of crudes.
As per the disclosure in the FAR ASX release of 20 January, Glencore Plc shall remain a lender to FAR Limited and the offtake is expected to be a minimum of 20 million barrels (which represents FARâs share of the project) following first oil for a period of 7 years expected to be produced during that time.
With 15 per cent of interest, the African explorer made two world class oil discoveries, namely, the SNE-1 and FAN-1 in late 2014. These discoveries were made in the Sangomar Deep portion of its offshore Senegal PSC. Senegal was transformed into one of the worldâs most sought after exploration destinations after these two basins opening discoveries, which changed global oil industry perceptions of the regionâs petroleum significance.
In 2017, the FAN South-1 and SNE North-wells drilled, two more discoveries were made offshore Senegal by FAR Limited and its JV partners in addition to the appraisal of the Sangomar Field. FAN-1 along with these discoveries, demonstrate the prolific oil-bearing nature of the source rocks in the basin and are yet to be appraised.

(Source: Companyâs website)
About FAR Limited
Africa focussed, Australian Securities Exchange listed, FAR Limited (ASX:FAR) is an independent, oil and gas exploration and development company with high value assets located in Australia, East Africa, and West Africa. Incepted in 1984 in Western Australia, formerly known as First Australian Resources NL, the group became a public quoted company in 1985 and changed its name to FAR Limited in 2010. FARâs mission is to generate value through continued growth and exploration success for shareholder investment and other key stakeholders.
The ASX listed explorer holds a portfolio of exploration licences in the Gambia, Guinea-Bissau and the Senegal in West Africa. FAR Ltd also holds acreage surrounded by proven petroleum systems in the state of Western Australia. FAR Ltd has exploration acreage in the emerging oil and gas province of Kenya in Eastern African region. The Africa focussed explorer has a highly experienced board and management team with strong network and connections across Africa with a robust balance sheet.
About Glencore PLC
Glencore PLC (LON: GLEN) is a major producer and marketer of more than 60 commodities and one of the worldâs largest globally diversified natural resource companies. The Company's operations comprise of nearly 150 oil production assets and mining & metallurgical sites.
The companyâs marketing and industrial activities are carried out through strong presence in 35 plus nations by a global network of offices. Including contractors, Glencore's has a human resource base of around 158,000 people. The company has a diverse customer base which hails from the automotive, power generation, steel, oil and other industrial sectors. In addition, the company is also into business of aiding producers and consumers of commodities in terms of financing, logistics and other services.
Glencore PLC Financial Highlights â H1 Financial year 2019 (30th June 2019, $, million)
Adjusted EBITDA of the company was US$5,582 million and Adjusted EBIT was US$2,229 million over H1 2019, representing decreases of 32% and 56% respectively compared to H1 2018, mainly driven by lower commodity prices, including a material cobalt reported loss within marketing, partially offset by a strengthening U.S. dollar (on average) against many of the key producer country currencies.
Net income attributable to equity holders decreased from US$2,776 million in H1 2018 to US$226 million in H1 2019 and EPS decreased from US$0.19 per share to US$0.02 per share, driven by lower average period-over-period commodity prices (notably cobalt and thermal coal) and impairment charges in the Chad oil and African copper portfolios, owing to the expiration of certain oil exploration licenses and revisions to the Mutanda mine plan as a result of lower cobalt prices.
In addition to these, net negative macro influences, Adjusted EBITDA/EBIT was further impacted by the continuing operational challenges in the African copper portfolio and that, relative to the comparative period where the ramp-up costs at Koniambo nickel were being capitalised, as of 1 January 2019, such operational costs are now expensed, notwithstanding that it is still in ramp-up phase with significantly higher costs than eventual steady state. Reflecting these, Adjusted EBITDA mining margins were 27% (39%, excluding African Copper and Koniambo) in the metal operations and 40% in the energy operations, compared to 42% and 41% respectively during H1 2018.
Glencore PLC Stock price performance
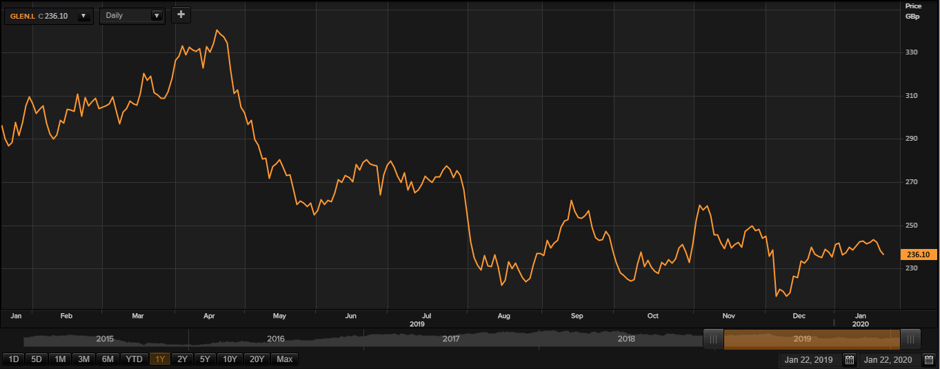
Daily Chart as on 22-January-20, before the market closed (Source: Thomson Reuters)
On 22nd January 2020, GLEN shares were clocking a current market price of GBX 236.10 per share, while writing at 11:20 AM Greenwich Mean Time. At the time of writing, the companyâs market capitalisation was hovering around at £31.62 billion.
The companyâs shares were trading at 31.35 per cent lower from the 52-week high price mark and 11.32 per cent higher than the 52-week low price mark at the current trading level as can be seen in the price chart. On 17th April 2019, the shares of GLEN have touched a new peak of GBX 343.90 and reached the lowest price level of GBX 212.10 on 6th December 2019 in the last 52 weeks.
The stockâs traded volume was hovering around 3,321,412 at the time of writing before the market close. The companyâs 5-day stock's daily average traded volume was 20,393,683.40; 30 days daily average traded volume- 25,828,775.10 - and 90-days daily average traded volume â 31,791,812.19. The volatility of the companyâs stock was more than twice as compared with the index taken as the benchmark, as the beta of the companyâs stock was recorded at 2.10 with a dividend yield of 6.82 per cent.
The shares of the company have delivered a positive return of 2.28 per cent in the last quarter. The companyâs stock surged by 1.13 per cent from start of the year to till date. However, the companyâs stock has given investors 19.61 per cent of a negative return in the last one year.Â