


_06_04_2026_00_29_48_108019.jpg)

Sage Group Plc
The provider of integrated accounting, payroll and payments solutions, Sage Group Plc (SGE) is headquartered in Newcastle upon Tyne, the United Kingdom. Its bookkeeping arrangements are Sage One, Sage X3 and Sage Live; its instalments arrangements are Sage Payments and Sage Pay; and its finance arrangements are Sage One Payroll, Sage X3 People and Sage 50 Payroll. The group is having a representative base of around thirteen thousand work force serving in excess of 3 million clients in over 20 nations.
SGE-Recent News
The group has entered into an accord with Elavon, owned by the U.S. Bancorp, for the sale of business. It is necessary for Elavon to acquire administrative endorsement from the Board of Governors of the Central Bank of Ireland and the Federal Reserve System in the United States. The total amount under consideration for the deal is £232 million.
SGE-Financial Highlights for H1 FY19
(Source: London Stock Exchange)
The companyâs top-line and the bottom-line performance had improved for the H1 of the financial year 2019. The revenue of the company for the third quarter and for the 9M had shown progressive growth as compared to the previous year.
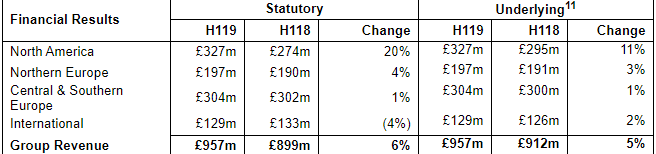
The underlying revenue of the company increased to £957 million For the first half of the fiscal year 2019 as compared to £908 million in H1 FY2018. The reported revenue of the company was £957 million for H1 FY2019 as against £899 million in H1 FY2018.
The adjusted operating profit of the company was recorded at £218 million in the first half of the fiscal year 2019 as compared to £222 million in H1 FY2018. The statutory operating profit of the company increased to £210 million in the first half of the fiscal year 2019 as against £186 million in H1 FY2018. The underlying PBT (Profit before tax) for the first half of the fiscal year 2019 was £205 million as against £208 million in H1 FY2018. The reported PBT of the company increased to £198 million in the first half of the fiscal year 2019 as against £171 million in H1 FY2018. The reported Profit increased to £154 million the first half of the fiscal year 2019 from £135 million in H1 FY2018. The statutory basic earnings per share of the company stood at 14.19 pence the first half of the fiscal year 2019 versus 12.50 pence in H1 FY2018. The reported diluted earnings per share of the company stood at 14.12 pence the first half of the fiscal year 2019 versus 12.48 pence in H1 FY2018.
SGE-Share price performance
(Source: Thomson Reuters)
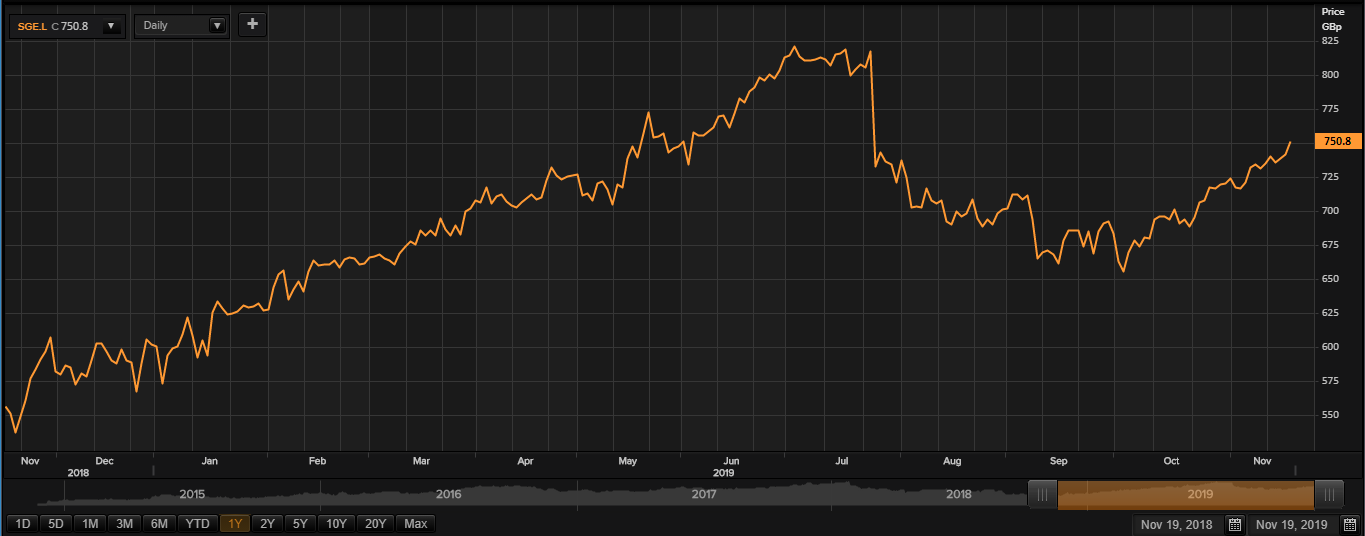
While writing (as on 19th November 2019, at 12:33 PM GMT), Sage Group Plc shares were trading at GBX 750.80 per share; surged by 1.34 per cent as compared to the previous day closing price level. The companyâs total market capitalisation was approximately £8.03 billion.
SGE shares have made a high of GBX 826.00 (as on 03rd July 2019) and a low of GBX 491.30 (as on 21st November 2018) in the past one year. At the current price point, as quoted in the price chart, the companyâs shares were trading 9.10 per cent below the 52-week high price point and 52.81 per cent above the 52-week low price point.
At the time of writing, the stockâs volume before the market close, stood at 480,207. Stock's average daily traded volume for 5 days was 2,169,485.60; 30 days- 1,969,571.30 and 90 days â 2,208,360.29. The companyâs stock beta (5Y monthly) was 0.82, which makes it less volatile as against the benchmark index.
The average daily traded volume for 5 days surged by 10.15 per cent as against 30 days average daily traded volume. At the time of writing, the shares of the company were trading above the 30-days and 60-days SMA.
In the past 1 month, SGE shares have delivered a negative return of 7.36 per cent. On a YTD (Year-to-Date) time interval, the stock surged by approximately 23.18 per cent and was up by 5.98 per cent in the last three months.
Share's RSI (Relative Strength Index) for the 30-days, 14-days and 9-days was recorded at 58.85, 68.32 and 72.45 respectively. Also, the stockâs 3-days RSI was recorded at 76.26.
Aviva Plc
Aviva Plc (AV.) is a global composite insurance provider company based out of London, the United Kingdom. The company offers a wide scope of investment funds and protection items against uncertainties - which include life, general and medical coverage â and operates as an asset management company. It is the UK's largest insurer and is country's only large scale, multi-line insurer, and has a strong international presence in Europe, Canada and Asia.
AV-Recent News
On 18th November 2019, Aviva announced response to the media speculations regarding Asian businesses. After careful review of its Singapore business, the company has confirmed the retention of business for the best value for shareholders. The company will also retain its joint venture in the Chinese region. The companyâs China and Singapore business have delivered double-digit growth in operating profit in FY2018. The company is also looking to delve into strategic alternatives for operations based in Hong Kong, Indonesia and Vietnam. Aviva will announce its full-year results for FY2019 on 5th March 2020.
AV-Financial Highlights for H1 FY19 (30th June 2019, GBP, million)
(Source: Companyâs website)
The company has decent fundamentals with a robust and resilient balance sheet, which is supported by lower interest expense and a reduction in the weighted average shares in issue. The challenging macro backdrop, particularly a very low government bond yields, is anticipated to continue in the H2 FY19 with ongoing uncertainty in the political environment and a softer position for economic growth in the UK and Europe.Â
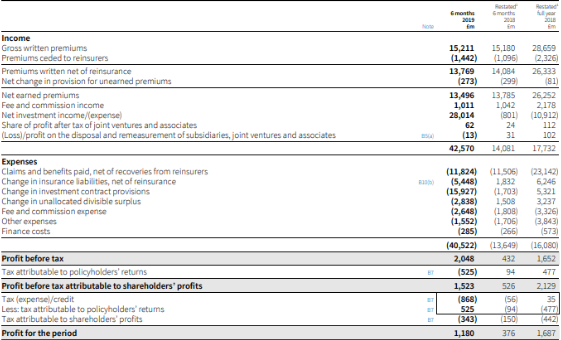
In the first half of the financial year 2019, Gross written premium was at £15,211 million versus £15,180 million in H1 FY2018. The companyâs total income for the first half of the financial year 2019 was at £42,570 million versus £14,081 million in H1 FY2018. The increase in total income was driven by a significant increase in the revenue from Net investment income for the period. The companyâs operating profit for the H1 FY2019 was at £1,448 million in H1 FY2019 versus £1,438 million in H1 FY2018. The PBT (Profit before tax) for the first half of the financial year 2019 stood at £2,048 million as against £432 million in H1 FY2018. The companyâs Basic earnings per share were up by 257 per cent to 28.2 pence in the first half of the financial year 2019 from 7.9 pence in the first half of the financial year 2018.  The company increased its interim dividend per share by 3 per cent to 9.50 pence in H1 FY2019 from 9.25 pence in H1 FY2018.
AV-Share price performance
(Source: Thomson Reuters)
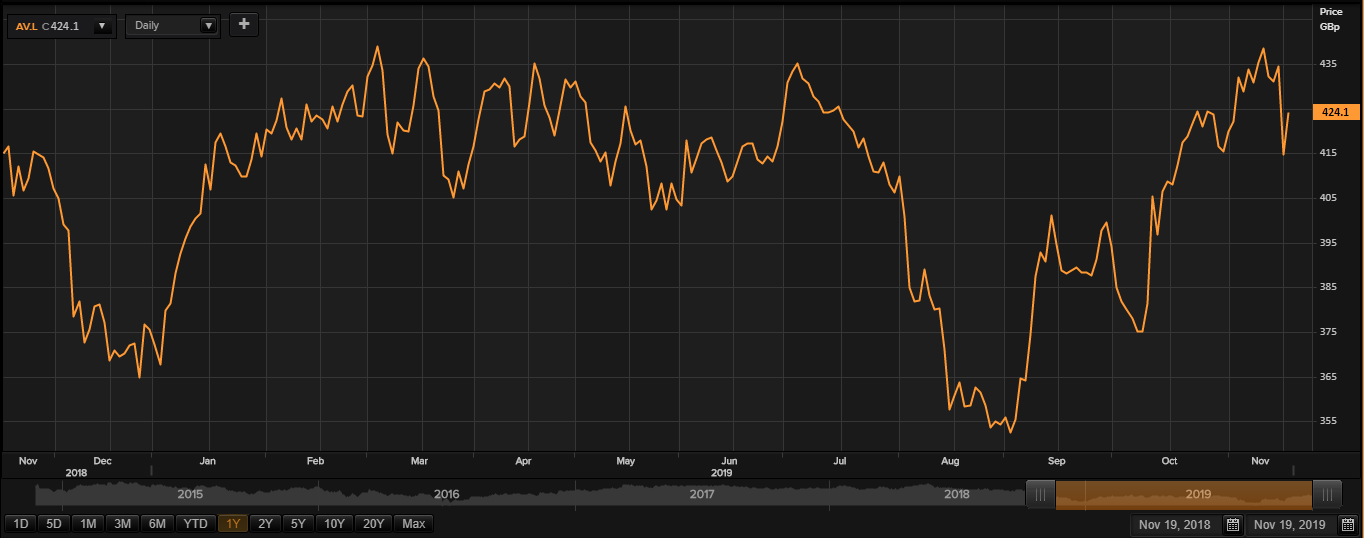
While writing (as on 19th November 2019, at 12:39 PM GMT), Aviva Plc shares were trading at GBX 424.10 per share; surged by 2.31 per cent as compared to the previous day closing price level. The companyâs total market capitalisation was approximately £16.17 billion
AV.shares have clocked a high of GBX 446.00 (as on 16th April 2019) and a low of GBX 350.00 (as on 28th August 2019) in the past year. At the current price point, as quoted in the price chart, the companyâs shares were trading 4.91 per cent below the 52-week high price point and 21.17 per cent above the 52-week low price point.
At the time of writing, the stockâs volume before the market close, stood at 2,992,652. Stock's average daily traded volume for 5 days was 14,664,951.20; 30 days- 11,322,684.87 and 90 days â 10,431,387.02. The companyâs stock beta (5Y monthly) was 1.14, which makes it more volatile as against the benchmark index.
The average daily traded volume for 5 days surged by 29.52 per cent as against 30 days average daily traded volume. At the time of writing, the shares of the company were trading above the 60-days and 200-days SMA.
In the past 1 month, AV shares have delivered a positive return of 0.56 per cent. Also, on a YTD (Year-to-Date) time interval, the stock surged by approximately 10.39 per cent and was up by 14.92 per cent in the last three months.
Share's RSI (Relative Strength Index) for the 30-days, 14-days and 9-days was recorded at 52.29, 46.25 and 38.52 respectively. Also, the stockâs 3-days RSI was recorded at 15.47.
