


CentralNic Group PLC (LON:CNIC)
CentralNic Group Plc (LON:CNIC) is a London, the United Kingdom-based designer and administrator of programming platforms, which possesses one of the world's spearheading registry specialist providers, CentralNic Ltd. The group's activities are segregated in three operating divisions: Reseller, Small Business and Corporations.
CNIC-Trading update and recent developments
The company recently acquired web services company, Team Internet AG for US$ 48 million and released a trading update for the third quarter of the fiscal year 2019. The company recorded unaudited revenues of US$77.1 million and adjusted EBITDA of US$13.1 million for the nine-month period ended 30th September 2019. The companyâs net debt stood at US$35.9 million as on 30th September 2019 along with strong cash generation. The company will have to pay US$48 million in total consideration for the acquisition of leading domain name monetisation services provider, Team Internet, out of which US$45 million is to be paid in cash, which shall be funded by an underwritten bond issue. This move by the company is expected to enhance companyâs earnings significantly in the fiscal year 2020. This shall also create cross-selling opportunities by expanding the customer base.
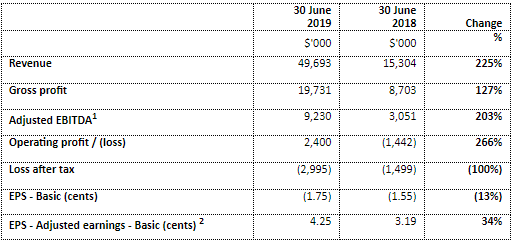
CNIC-Financial Highlights (for the six months ended 30 June 2019)
 (Source: London Stock Exchange)
Led by the successful acquisition of the three companies, and strong performance recorded by KeyDrive which was acquired in the previous financial year, the companyâs revenue moved to $49.7 million and recorded a surge of 225 per cent against $15.3 million reported in the year-ago period. Gross profit surged by 127 per cent to $19.73 million on a YoY basis.
On a YoY basis, the adjusted EBITDA surged by 203 per cent to $9.2 million as compared with the corresponding period of the last year, driven by a combination of progress with the acquisition, and underlying organic growth of 6 per cent. In the first half of 2019, the operating profit rose by 266 per cent to $2.4 million against a loss of $1.4 million in H1 FY18. However, loss after tax jumped by 100% to $2.99 million from $1.49 million reported in the H1 FY18, on account of steep escalation of net finance cost to $4.02 million from $0.47 million in the year-ago period. Basic loss per share expanded by 13 per cent to 1.75 cents against the loss per share of 1.55 cents in H1 FY18, while adjusted earnings (basic) per share surged by 34 per cent to 4.25 cents in H1 FY19.
In H1 FY19, the reported cash balance surged by 73 per cent to $17.9 million against the same period in 2018. The net debt for the first half of 2019 was reported at $6 million, a decrease of 47 per cent from the corresponding period of the last year.
The group is vulnerable to risk related to deposits, credit risks, systematic risks, IT security, impact on society, currency exchange fluctuations and other risks emerging from financial instruments.
In the first half of the fiscal year 2019, the group recorded robust growth, which was to a great extent driven by the strategic acquisitions which the company executed earlier and mirrors the fruitful execution of the group's growth model. Likewise, the gross margin and adjusted EBITDA margin of the recently acquired businesses are improving, and the management is certain of accomplishing an entire year of development similar to what was accomplished in the first half of the fiscal year 2019.
CNIC-Share price performance
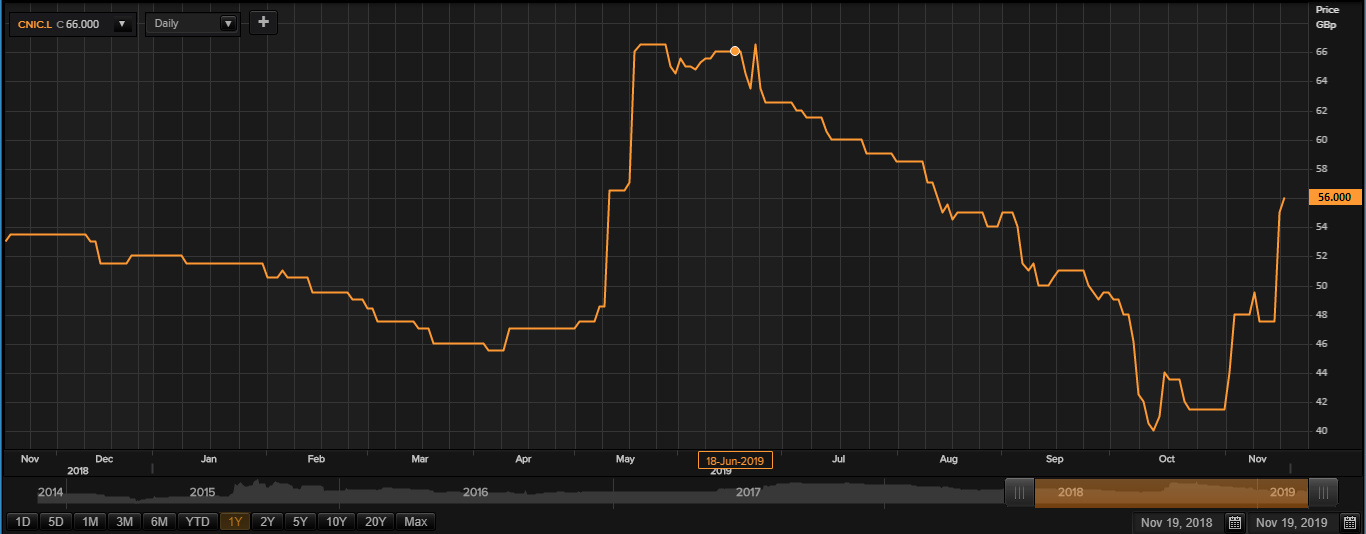 Daily Chart as at 19-November-19, before the market closed (Source: Thomson Reuters)
On 19th November 2019, while writing at 10:11 AM GMT, CentralNic Group Plc shares were clocking a current market price of GBX 56.00 per share; which was more by 1.81 per cent in comparison to the last traded price of the previous day. At the time of writing, the companyâs market capitalisation stood at £99.58 million.
On 24th June 2019, the shares of CNIC have attained a new peak of GBX 68.50 in the last 52 weeks and had reached the lowest price level of GBX 39.00 on 16th October 2019. The companyâs shares were trading 18.24 per cent down from the 52-week high price mark and 43.58 per cent above the 52-week low price mark at the current trading level.
The stockâs total traded volume was around 99,961 at the time of writing. The companyâs average 5-day daily traded volume of stock was 162,734.00; 30 days daily average traded volume and 90-days daily average traded volume stood at 166,928.73 and 88,851.72 respectively.
The shares of the company returned 0.92 per cent to the investors in the last quarter. The companyâs stock surged by 5.77 per cent from the start of the year to till date and has given 3.77 per cent of a positive return to the investors in the last year.Â
Touchstone Exploration Inc (LON:TXP)
Touchstone Exploration Inc (LON:TXP), till recently the company was known as Petrobank Energy and Resources Ltd. It is an oil and gas exploring and producing group. The groupâs areas of operations include Canada and Trinidad.
TXP-Q3 Trading update
The company was able to produce 1,729 barrels per day of crude oil for the three-month period ended 30th September 2019, which was less by 2 per cent as compared to the same period the previous year. The companyâs first well for exploration (Ortoire) was drilled successfully and presently rigged to commence production testing. The company mustered an operating netback of $24.56 /barrel in Q3 of the fiscal year 2019. The company ended the quarter with a net debt of $12,286,000 and a cash balance of $3,423,000. The companyâs financial liquidity improved as the credit facility of the group was extended to C$20 million from C$15 million in October 2019.
TXP-Financial highlights
 (Source: London Stock Exchange)
The companyâs revenue increased to US$20,723 in H1 FY19 as compared to US$17,897 in H1 FY18. The companyâs Earnings before income taxes increased to US$3,533 thousand in H1 FY19 as compared to US$2,969 thousand in H1 FY18. The companyâs net loss increased to US$ 1,018 thousand in H1 FY19 as against US$ 393 thousand in H1 FY18. The company had cash balances of US$ 7,250 thousand as on 30th June 2019. The company delivered fund flow of $1,310,000 from operations during the second quarter of the fiscal year of 2019.
TXP-Share price performance
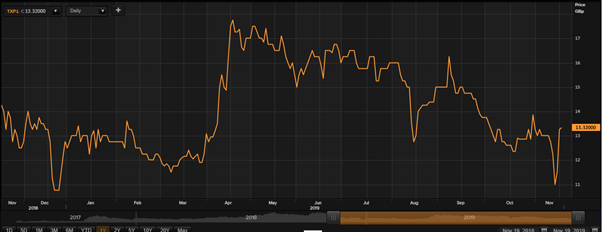 Daily Chart as at 19-November-19, before the market closed (Source: Thomson Reuters)
On 19th November 2019, while writing at 10:16 AM GMT, Touchstone Exploration Inc shares were clocking a current market price of GBX 13.32 per share; which was more by 0.52 per cent in comparison to the last traded price of the previous day. At the time of writing, the companyâs market capitalisation stood at £21.58 million.
On 17th April 2019, the shares of TXP have attained a new peak of GBX 18.40 in the last 52 weeks and had reached the lowest price level of GBX 9.80 on 14th November 2019. The companyâs shares were trading 27.60 per cent down from the 52-week high price mark and 35.91 per cent above the 52-week low price mark at the current trading level.
The stockâs total traded volume was around 829,902 at the time of writing. The companyâs average 5-day daily traded volume of stock was 1,205,129.00; 30 days daily average traded volume and 90-days daily average traded volume stood at 431,192.00 and 296,650.67 respectively. The volatility of the companyâs stock was slightly lower than the benchmark index, as the beta of the companyâs stock was recorded at 0.96.
The shares of the company returned 1.92 per cent to the investors in the last quarter. The companyâs stock surged by 3.92 per cent from the start of the year to till date and has given 7.02 per cent of a negative return to the investors in the last year.Â
