


Croda International Plc full year results for FY19
(Companyâs filings, London Stock Exchange)
In the near term, the companyâs performance shall be influenced by several factors. The biosurfactant plant is now operational in North America to support organic growth. Through recent technology acquisitions, the company made good progress. Innovation is an integral part of the companyâs scheme of things. The company looks forward to reinvesting to capitalise on future growth opportunities.
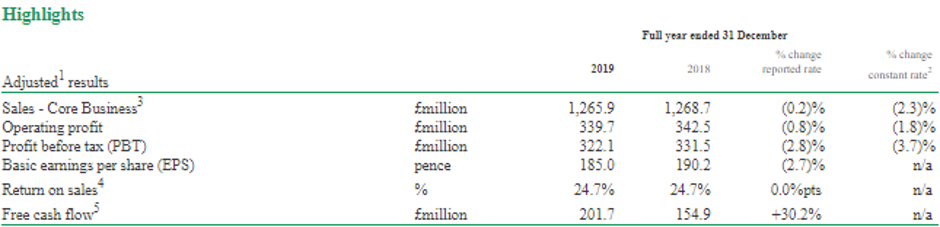
The companyâs sales reduced by 0.7 per cent to £1,377.7 million in reported currency during the fiscal year 2019 as against £1,386.9 million in the fiscal year 2018. The companyâs sales were down by 2.6 per cent, although the company reaped benefits of £11 million from acquisitions on constant currency. The companyâs adjusted operating profit decreased by 0.8 per cent to £339.7 million during the period in the reported currency as against £342.5 million in the fiscal year 2018. Due to lower sales and the impact of acquisitions, the Adjusted operating profit declined by 1.8 per cent in constant currency during the year.
However, the return on sales remained flat at 24.7 per cent (in reported currency) during the year reflecting the strong business model. The companyâs free cash flow was up 30.2 per cent to £201.7 million during 2019 as against £154.9 million in the fiscal year 2018. The companyâs Basic EPS was down by 4.7 per cent to 172.8 pence in the fiscal year 2019 as against 181.4 pence in 2018. The companyâs annual dividend surged by 3.4 per cent to 90.0 pence during the period.
Business overview: Croda International Plc
Croda International PLC (LON:CRDA) is an East Yorkshire, United Kingdom-headquartered chemical company that creates, manufactures and markets speciality chemicals for a range of diverse products including health and beauty, engine lubricants, plastics and many more. The operations of the group are differentiated in four operating segments: Industrial Chemicals, Performance Technologies, Life Sciences and Personal Care. The group targets industries and consumers worldwide to offer solutions to customer and market needs and is continuously investing in existing markets and expanding into emerging markets.
Croda International Plc -Stock price performance
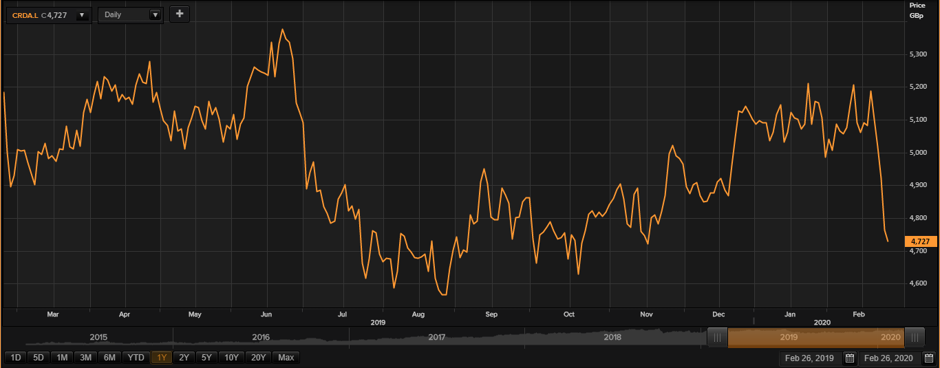
Daily Chart as at Feb-26-20, before the market close (Source: Thomson Reuters)
On 26th February 2020, at the time of writing (before market close, GMT 10:46 AM), Croda International Plcâs shares were trading at GBX 4,727, down by 0.73 per cent against its previous day closing price. Stock's 52 weeks High and Low is GBX 5,415.00 /GBX 4,510.00. At the time of writing, the share was trading 12.71% lower than its 52w high and 4.81% higher than its 52w low. Stockâs average traded volume for 5 days was 387,121.60; 30 days â 318,322.77 and 90 days â 337,944.37. The average traded volume for 5 days was up by 21.61% as compared to 30 days average traded volume. The companyâs stock beta was 0.77, reflecting lesser volatility as compared to the benchmark index. The outstanding market capitalisation was around £6.10 billion along with a dividend yield of 1.89%.
Â
Meggitt PLC Results for FY19
(Source: Companyâs filings, London Stock Exchange)
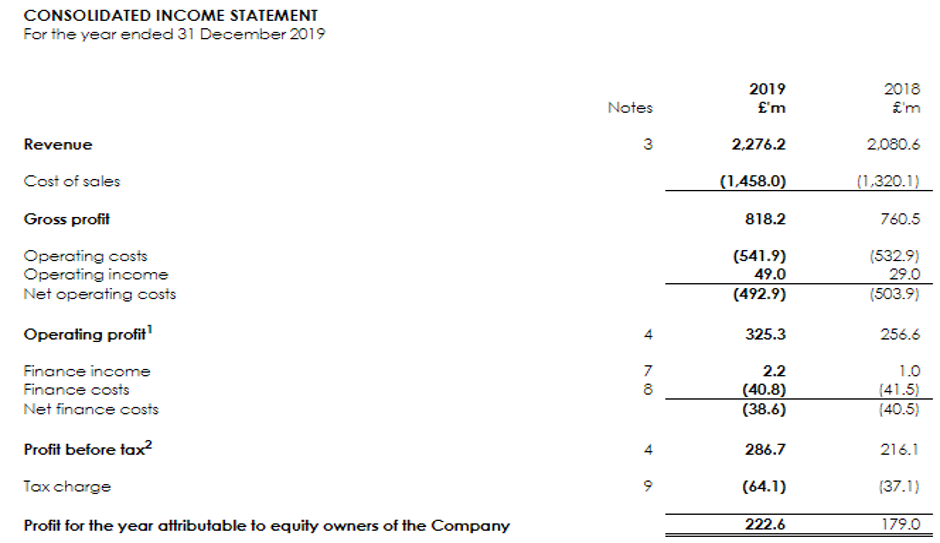
The companyâs reported revenue increased by 9 per cent to £2,276.2 million in FY19 as compared to £2,080.6 million in FY18. The companyâs Underlying earnings per share increased by 9 per cent to 37.3 pence in FY19 as compared to 34.2 pence in FY18. The operating profit for the year 2019, on a statutory basis, increased by 27 per cent to £325.3 million as against £256.6 million in FY18. The companyâs profit before taxation increased by 33 per cent to £286.7 million in FY19 as against £216.1 million in FY18. The companyâs Statutory profit for the year was £222.6 million during the financial year 2019 as against £179 million in the fiscal year 2018. The companyâs Statutory earnings per share increased by 24 per cent to 28.8 pence in FY19 as against 23.2 pence in FY18. The annual dividend of the company surged by 5 per cent to 17.50 pence during the period as against 16.65 pence in FY18.
Business overview: Meggitt PLC
Meggitt PLC (LON:MGGT) is a United Kingdom-headquartered engineering company that offers advanced technologies, products and services. The groupâs operations are segregated in five operating segments: Meggitt Equipment Group, Meggitt Sensing Systems, Meggitt Polymers & Composites, Meggitt Control Systems, and Meggitt Aircraft Braking Systems. The company operates in more than 15 countries and focuses on three core sectors, namely aerospace, defence and energy. The differentiated technology and products of the company are underpinned by deep intellectual property, across a wide range of applications.
Meggitt PLC -Stock price performance
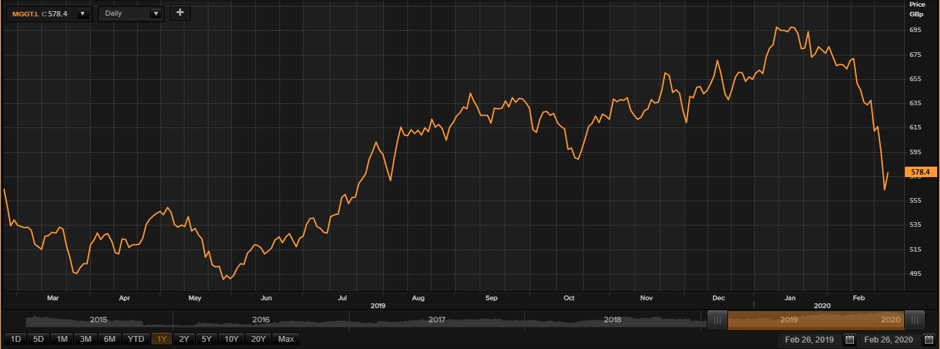
Daily Chart as at Feb-26-20, before the market close (Source: Thomson Reuters)
On 26th February 2020, at the time of writing (before market close, GMT 10:50 AM), Meggitt PLCâs shares were trading at GBX 578.40, up by 2.59 per cent against its previous day closing price. Stock's 52 weeks High and Low is GBX 701.80 /GBX 484.30. At the time of writing, the share was trading 17.58% lower than its 52w high and 19.43% higher than its 52w low. Stockâs average traded volume for 5 days was 2,618,778.00; 30 days â 2,062,717.43 and 90 days â 1,757,776.98. The average traded volume for 5 days was up by 26.96% as compared to 30 days average traded volume. The companyâs stock beta was 0.84, reflecting lesser volatility as compared to the benchmark index. The outstanding market capitalisation was around £4.36 billion along with a dividend yield of 3.10%.
Â
Weir Group Plc Results for FY19
(Source: Companyâs filings, London Stock Exchange)
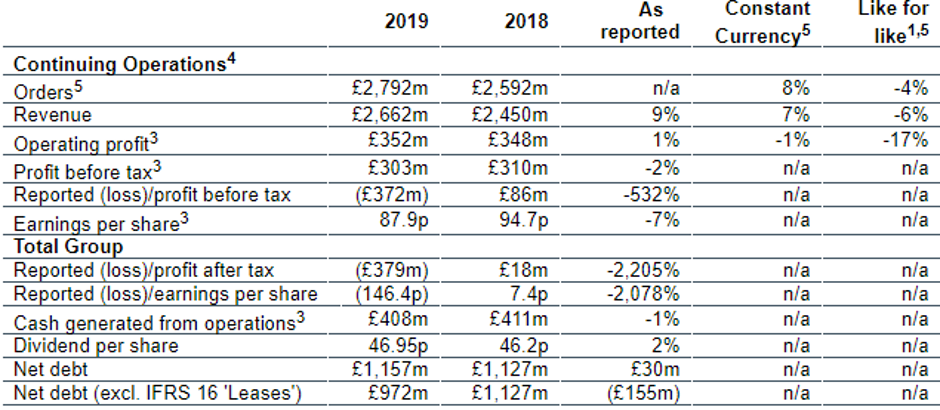
On 26th February 2020, Weir Group Plc delivered strong results for the year. The Companyâs Continuing operations order input increased by 8 per cent on a constant currency basis to £2,792 million due to strong growth in Minerals. The Companyâs Continuing operations revenue grew by 7 per cent to £2,662 million on constant currency basis due to strong input performance in Minerals.
The companyâs Operating profit from continuing operations improved by 1 per cent (on a reported basis) to £352 million excluding intangibles amortisation and exceptional items. The Groupâs Profit before taxation from continuing operations plunged by 2 per cent to £303 million during the period, excluding exceptional items. The Earnings per share (EPS) from continuing operations decreased by 7 per cent to 87.9 pence during the period as against 94.7 pence in 2018.
Looking ahead in the times to come, there is a certain level of risk involved for the company as the coronavirus (COVID-19) is impacting the global economy and demand for natural resources. The company expects normalised demand to muster good constant currency growth in its mining-focused businesses.
Business overview: Weir Group Plc
Incepted in 1871, the UK based Weir Group Plc (LON:WEIR) is an industrial engineering company. The Group was founded by two brothers George and James Weir, who started their engineering company registered in the name of G. & J. Weir in Scotland (West Coast). The company aims to provide the growing world with essential resources by solving the toughest operating challenges efficiently keeping in check the safety and sustainability of the solution. The Group has manufacturing units and research facilities across the globe. The company has clientele in more than 50 nations, servicing infrastructure, mining and oil & gas solutions.
Weir Group Plc -Stock price performance
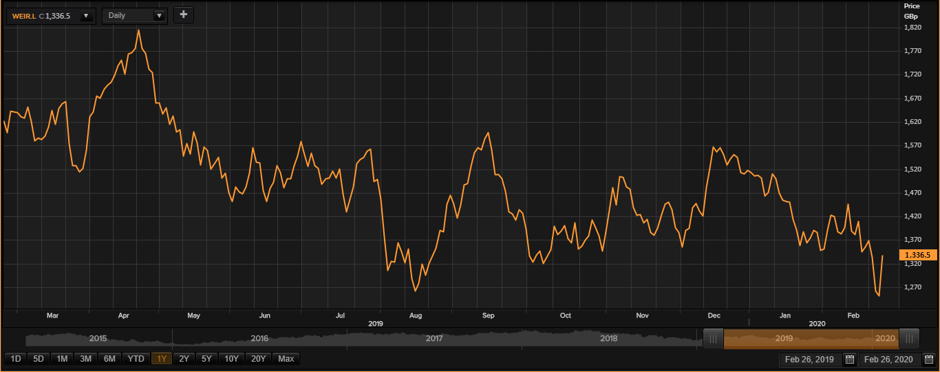
Daily Chart as at Feb-26-20, before the market close (Source: Thomson Reuters)
On 26th February 2020, at the time of writing (before market close, GMT 10:54 AM), Weir Group Plcâs shares were trading at GBX 1,336.50, up by 6.88 per cent against its previous day closing price. Stock's 52 weeks High and Low is GBX 1,819.72 /GBX 1,244.00, respectively. At the time of writing, the share was trading 26.55% lower than its 52w High and 7.44% higher than its 52w low. Stockâs average traded volume for 5 days was 1,174,499.60; 30 days â 898,107.03 and 90 days â 900,984.32. The average traded volume for 5 days was up by 30.78% as compared to 30 days average traded volume. The companyâs stock beta was 1.61, reflecting higher volatility as compared to the benchmark index. The outstanding market capitalisation was around £3.23 billion along with a dividend yield of 3.75%.
