


Highlights
- IOF realized an 18.5% revenue increment in FY23, continuing its streak of six sequential years of revenue growth.
- IOF had a net cash position of USD 6.50 million by the end of FY23, compared to USD 5.90 million in FY22.
- For FY24, IOF expects EBITDA to range between USD 8.5 million and USD 9.0 million.
Iofina PLC (LSE: IOF), based in the United States, is focused on iodine exploration and production. It also specializes in the production of specialty chemical derivatives. It distributes its products worldwide through its divisions, Iofina Resources, and Iofina Chemical. The company is listed on the FTSE AIM All-Share index and has a market capitalization of GBP 33.96 million.
IOF experienced a notable 18.5% revenue increase in FY23, marking its sixth straight year of revenue growth. Despite this, gross profit saw a slight decline of approximately 0.6%. Strong growth in cash reserves and substantial debt reduction transformed IOF into a net cash position of USD 6.50 million by the end of FY23, compared to USD 5.90 million in FY22.
Further, in FY23, the company had a higher current ratio of 2.79x and a higher net margin of 13.1%, compared to the industry median of 1.75x and 4.4%, respectively.
Recent business update
Last month, IOF announced the launch of its new corporate website at www.iofina.com. Moreover, the company anticipates increasing site traffic with enhanced mobile and tablet compatibility.
Company outlook
Iofina Resources anticipates producing between 275 and 295Mt of crystalline iodine in H1 FY24 from its six current plants compared to 241.5Mt produced in H1 FY23. In terms of finance, the company expects FY24 EBITDA to range between USD 8.5 million and USD 9.0 million.
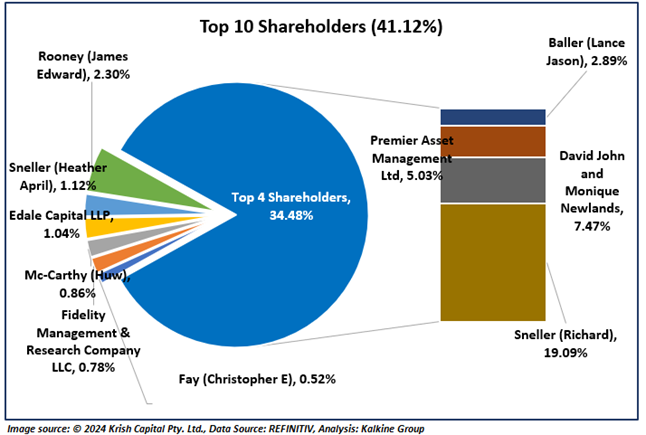
Top 10 shareholders
Iofina’s top ten shareholders together hold approximately 41.12% of the total shares. Richard Sneller is the largest shareholder, owning around 19.09% of the shares. David John and Monique Newlands follow with approximately 7.47% each, as shown in the chart below:
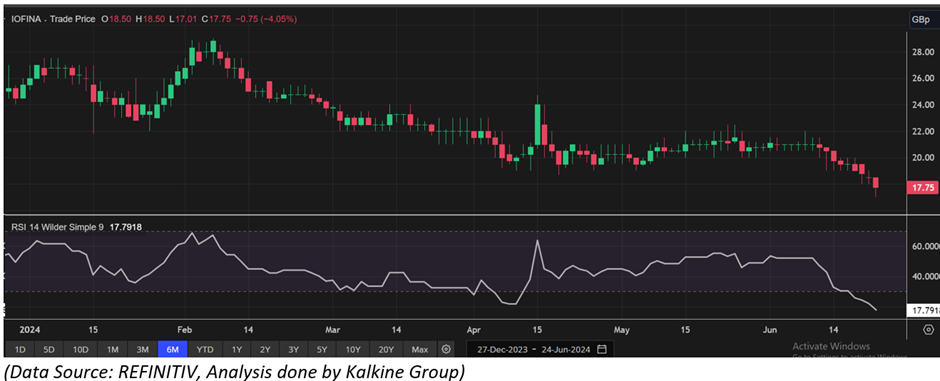
Stock performance
IOF's stock price has dropped approximately 11.72% in the past month and has declined by about 28.32% over the last six months. The stock has a 52-week range from GBX 17.01 to GBX 34.50. Currently, it is trading below the midpoint of its 52-week high and low range.
Note 1: Past performance is not a reliable indicator of future performance.
Note 2: The reference data for all price data, currency, technical indicators, support, and resistance levels is 24 June 2024. The reference data in this report has been partly sourced from EODHD/Others.
