


Greencoat Renewables PLC releases FY19 results
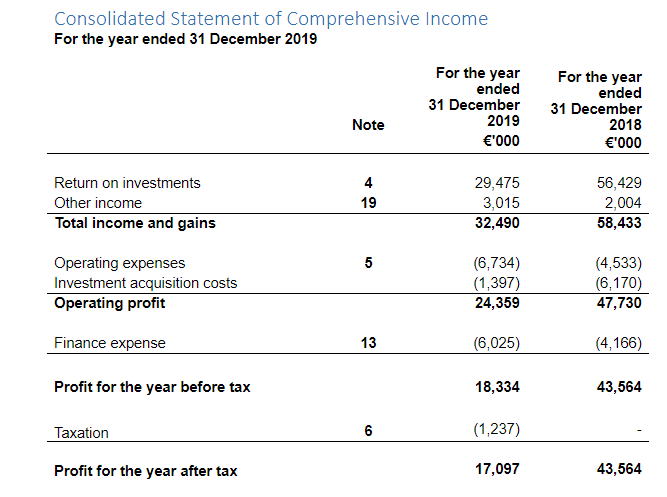
The company during the reported period added 3 new wind farms to its portfolio, making it 15 in total, which resulted in net generation capacity of 462 MW along with further investment in Cloosh Valley.  In the fiscal year 2019, the return on investments was recorded at â¬29,475 thousand.
The total income & gains of the company stood at â¬32,490 thousand in the fiscal year 2019. The operating profit of the company stood at â¬24,359 thousand in the fiscal year 2019. The companyâs profit for the year before taxation stood at â¬18,334 thousand in the fiscal year 2019. By the end of the fiscal year 2019, the NAV of the company stood at â¬650 million.
The company generated 1,154 GWh of electricity in the fiscal year 2019. The company generated strong cash flow with a net cash generation of â¬48.8 million during the year. Consistent with the progressive dividend policy, the companyâs total dividend per share for the fiscal year 2019 stood at 6.03 cents.
(Source: Companyâs filings, London Stock Exchange)Â
Business overview: Greencoat Renewables PLC
Ireland-based Greencoat Renewables PLC (LON:GRP) is mainly focused on investing in operational wind farms. With a primary focus on wind assets in Ireland, the company invests in renewable electricity generation assets and is a sector-focused listed renewable infrastructure company. The company aims to offer investors a progressive dividend policy along with a capital appreciation of their investments in the long term by reinvesting excess cash flow and exercising cautious leverage. The groupâs investment manager is Greencoat Capital LLP.
Greencoat Renewables PLC-Stock price performance
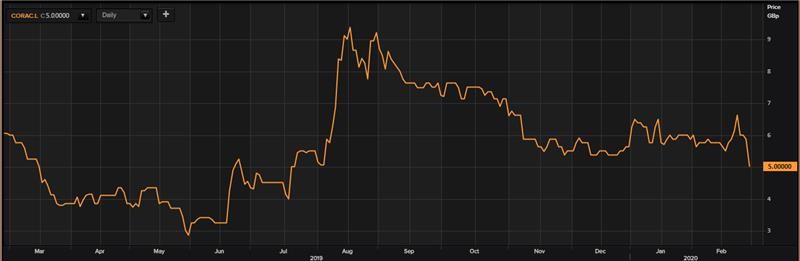
Daily Chart as on 02-March-20, before the market closed (Source: Thomson Reuters)
On 02nd March 2020, while writing at 02:15 PM GMT, Greencoat Renewables PLCâs shares were clocking a current market price of EUR 1.17 per share. The companyâs market capitalisation was at EUR 739.16 million at the time of writing.
On September 12th, 2019, the shares of Greencoat Renewables PLC have struck a new high of EUR 1.31 and struck a new low of EUR 1.05 on April 4th, 2019 in the last 52 weeks. The companyâs shares were trading at 10.69 per cent lower from the 52-week high price mark and 11.43 per cent higher than the 52-week low price mark at the current trading level as can be seen in the price chart.
The companyâs 5-day stock's daily average traded volume was 765,234.40; 30 days daily average traded volume- 941,853.90 - and 90-days daily average traded volume â 921,763.57. The volatility of the companyâs stock was negatively correlated as compared with the index taken as the benchmark, as the beta of the companyâs stock was recorded at negative 0.13 with a gross dividend yield of 5.07 per cent.
The shares of the company have delivered a positive return of 2.15 per cent in the last quarter. On a Year to date basis, the shares of the Group plunged by 0.42 per cent. Since last year, the shares of the company have given 10.19 per cent of positive return to investors.
Hiscox Limited released FY19 resultsÂ
Despite weathering a third consecutive year of storms, the companyâs retail profits were up in FY19.
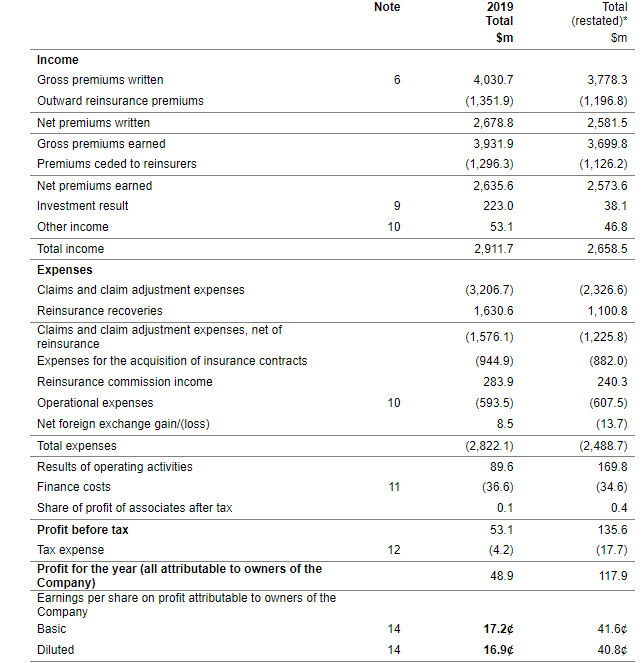
A series of catastrophe events impacted the Groupâs profits such as $25 million of reduction in fees and profit commissions along with $165 million earmarked for Hurricane Dorian and Typhoons Faxai and Hagibis. The profits of Hiscox Retail increased by 22 per cent to $178.4 million, making it a $2.2 billion business. Driven by a solid performance in the small business insurance segment, Hiscox Europe and Hiscox UK generated good profits. The total income of the company this year surged to $2,911.7 million as against $2,658.50 million in FY18. Growth in the Retail segment is expected to be in the range of 5 to 15 per cent for the fiscal year 2020. Despite the disciplined action taken by the company to reduce $200 million in underperforming lines, the Gross premiums written were up by 8.1 per cent in constant currency to $4,030.7 million in the fiscal year 2019.
The Group generated a strong investment return of $223.0 million during the year as against $38.1 million in FY18. In line with the Group's progressive dividend policy, the companyâs full-year dividend was up by 3.5 per cent to 29.6 cents in the fiscal year 2019.
(Source: Companyâs filings, London Stock Exchange)
Business overview: Hiscox LimitedÂ
Hiscox Limited (LON:HSX) is a global insurance group based in Bermuda. The group is known for its robust brand outlook across the world. The organisation is currently operating in around over 10 nations and has 30 plus office locations with an employee base of more than 3 thousand experts. The organisation, through its subsidiaries, works in geographically unique regions such as in the United States, Asia, Europe, the United Kingdom and Bermuda. The organisationâs business has been separated into four reportable segments being Hiscox London Market, Hiscox Re, Hiscox Retail and Corporate Centre. The Retail business contains the Hiscox United Kingdom and Ireland, Hiscox International and Hiscox Europe.
Hiscox Limited -Stock price performance
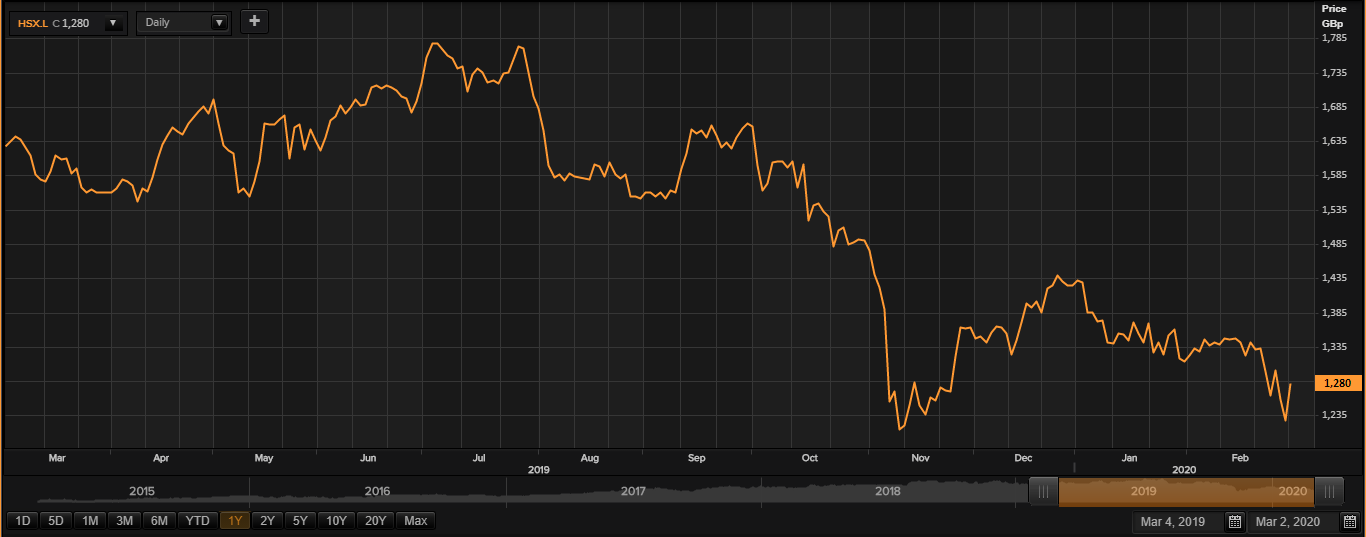
Daily Chart as on 02-March-20, before the market closed (Source: Thomson Reuters)
On 02nd March 2020, while writing at 02:04 PM GMT, Hiscox Limited shares were clocking a current market price of GBX 1,280.00 per share. The companyâs market capitalisation was at £3.54 billion at the time of writing.
On July 05th, 2019, the shares of Hiscox Limited have struck a new high of GBX 1,795.00 and struck a new low of GBX 1,140.00 on November 07th, 2019 in the last 52 weeks. The companyâs shares were trading at 28.69 per cent lower from the 52-week high price mark and 12.28 per cent higher than the 52-week low price mark at the current trading level as can be seen in the price chart.
The companyâs 5-day stock's daily average traded volume was 733,983.20; 30 days daily average traded volume- 596,687.63 - and 90-days daily average traded volume â 972,687.06. The volatility of the companyâs stock was 44 per cent lower as compared with the index taken as the benchmark, as the beta of the companyâs stock was recorded at 0.56 with a gross dividend yield of 2.76 per cent.
The shares of the company have delivered a negative return of 9.92 per cent in the last quarter. On a Year to date basis, the shares of the Group plunged by 13.90 per cent. Since last year, the shares of the company have given 23.33 per cent of a negative return to investors.
