


Boohoo Group PLC (LON:BOO)
The United Kingdom domiciled fashion apparel retailing company, Boohoo Group Plc is christened among the top online fashion retail company in the United Kingdom, having a presence outside of the United Kingdom in Europe, Australia and in the United States of America. The companyâs products are designed for young customers belonging to the age bracket of 16 to 30 years and some of its popular brands include Boohoo, PrettyLittleThing NastyGal, MissPap and boohooMAN. The shares of the company are quoted for trading on the Alternative Investment Market (AIM) segment of the London Stock Exchange.
BOO-Trading Update
The leading online fashion group, Boohoo group plc in a press release announced that the trading has remained strong across its key brands with a record performance across the Black Friday weekend that since its half year end. The company had strong operational performances from both warehouses.
Karen Millen, Coast, and MissPap, the newly introduced brands of the company, have been integrated successfully on the companyâs platform. Initial ranges have received a positive response, and the company continues to broaden its product line as it in line with the companyâs multi-brand strategy.
The company continues to do well in line with market expectations and is expected to release further detailed trading financial information for the four-month period ended 31st December 2019 on 14 January 2020.
BOO-Financial Highlights for H1 FY20
The companyâs revenue increased by 43 per cent to GBP 564.9 million due to strong revenue growth across all brands and geographies in the first half of the fiscal year 2020. In the first half of the fiscal year 2020, the companyâs gross profit was up by 40 per cent to GBP 306.5 million. The companyâs adjusted profit before tax increased by 83 per cent to GBP 45.2 million in the first half of the fiscal year 2020 in contrast to GBP 24.7 million in the first half of the fiscal year 2019. The revenue growth guidance given by the company was around 33 to 38 per cent with adjusted EBITDA margin at around 10 per cent for the financial year 2020.
The company has delivered solid results in the first half of the fiscal year 2020. The company has a positive outlook on the online fashion trends globally. The demand for online fashion provides a window of opportunity for continued growth at the international level. The company is expected to invest regularly in established as well as newly acquired brands.
BOO-Stock price performance
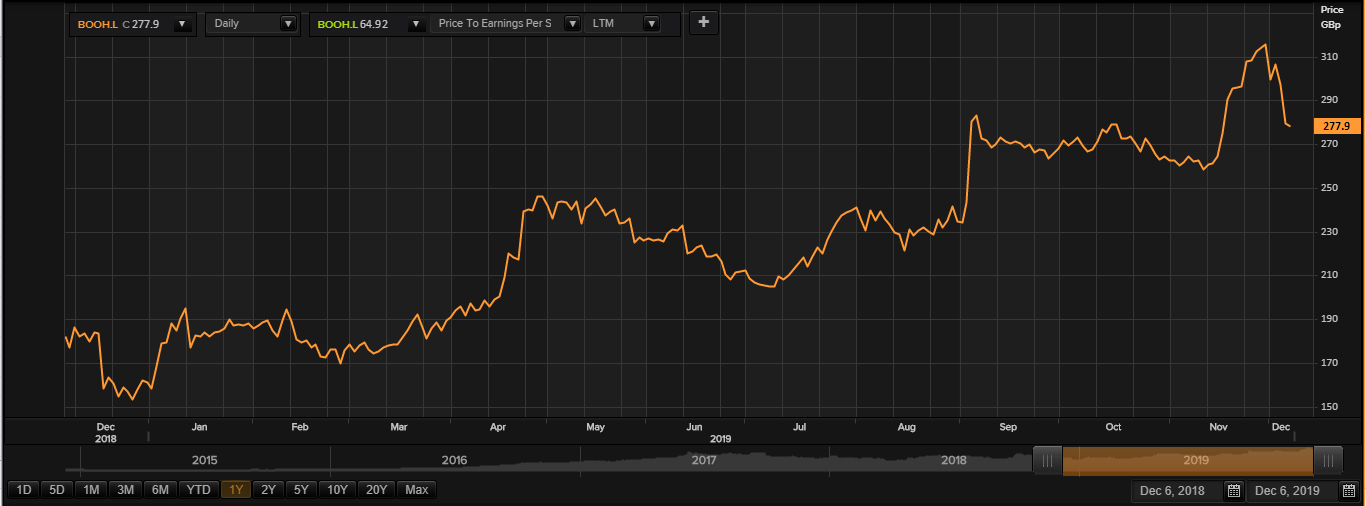
Daily Chart as at Dec-06-19, before the market close (Source: Thomson Reuters)
At the time of writing (before the market close, at 11:28 AM GMT), shares of the Boohoo Group PLC were trading at GBX 277.90 and decreased by 0.53 per cent against the previous day closing price. The shares of the company got admission for trading on the Alternative Investment Market of the London Stock Exchange on 14th March 2014. The total M-cap (market capitalisation) of the company stood at £3.23 billion.
Daily Traded Volume Summary
The 5-day average daily traded shares, which exchanged hands were recorded at 9,253,934.60, which was approximately 107.62 per cent more than the 30-day average daily traded shares, which exchanged hands at the LSE (London Stock Exchange). At the time of writing, before the market close, todayâs traded volume of the shares of the company was around 2,915,486 and number of trades executed stood at 1,853 at the LSE (London Stock Exchange).
52-week High/Low range
In the past 52 weeks, shares of the Boohoo Group PLC have hovered between a high price level of GBX 316.90 (as on 29th November 2019) and a low-price level of GBX 146.39 (as on 17th December 2018). At the current level of trading, as quoted in the price chart, shares traded around 12.30 per cent below the 52-week high and were 89.83 per cent above the 52-week low.
Price Performance (in percentage)
The shares of the Boohoo Group PLC have delivered a positive price return of 53.52 per cent on a Year on Year (YoY), have outperformed the benchmark index, as the benchmark index gave 48.87 per cent positive return over the same period. However, the stock has given a positive price return of approximately 73 per cent on a year-to-date (YTD) time frame and was up by approximately 7.50 per cent in the last one month.
Simple Moving Average (SMA)
From the Simple Moving Average standpoint, shares traded below the 30-day simple moving average price. Also, the shares traded above its 60-day and 200-day SMA prices.
Relative Strength Index (RSI)
The RSI indicator for the shares of the company for the 3-days, 9-days and 14-days was recorded at 14.00, 37.83 and 44.74, respectively. Also, the stockâs 30-days RSI was recorded at 51.43.
Dunelm Group PLC (LON:DNLM)
The UK based general retailer company, Dunelm Group Plc operates in the UK's homeware market. The key brands of the company are Dunelm and Dorma. Dunelm Plc has around 170 physical outlets and a total representative base of approximately 10,000 people. The company has a diverse range of product offering like furniture, curtains, blinds, bedding, rugs and decors through its platform and facilitates multichannel convenience through the online, mobile, catalogue, and telephone orders.
DNLM-Trading update
The UK's leading homewares retailer, Dunelm Group plc was pleased to announce that the company has successfully migrated all its customers to its new digital platform. The company now has a cloud-native platform which is modern and provides more flexibility to customers.
During this critical period of transition, there was no drop-in performance of the company. The company-maintained sales growth both online and in stores. The users have responded well to the new website.
 The companyâs cost of operations remained well controlled and in line with the companyâs expectations.
The board of the company now anticipates full year profit before taxation to be higher than the expectations and assuming constant demand from consumers due to the general election results. The company is expected to release a more detailed trading update on 9th January 2020.
DNLM-Financial highlights for FY19 period ended 29th June 2019

(Source: London Stok Exchange)
The companyâs total revenue was recorded at £1,100.4 million in FY19. The companyâs profit before taxation was recorded at £125.9 million in FY19. The companyâs basic EPS was recorded at 50.2 pence in FY19. The companyâs announced a special dividend of 32 pence making the total shareholder dividend to 60 pence for the year.
DNLM-Stock price performance
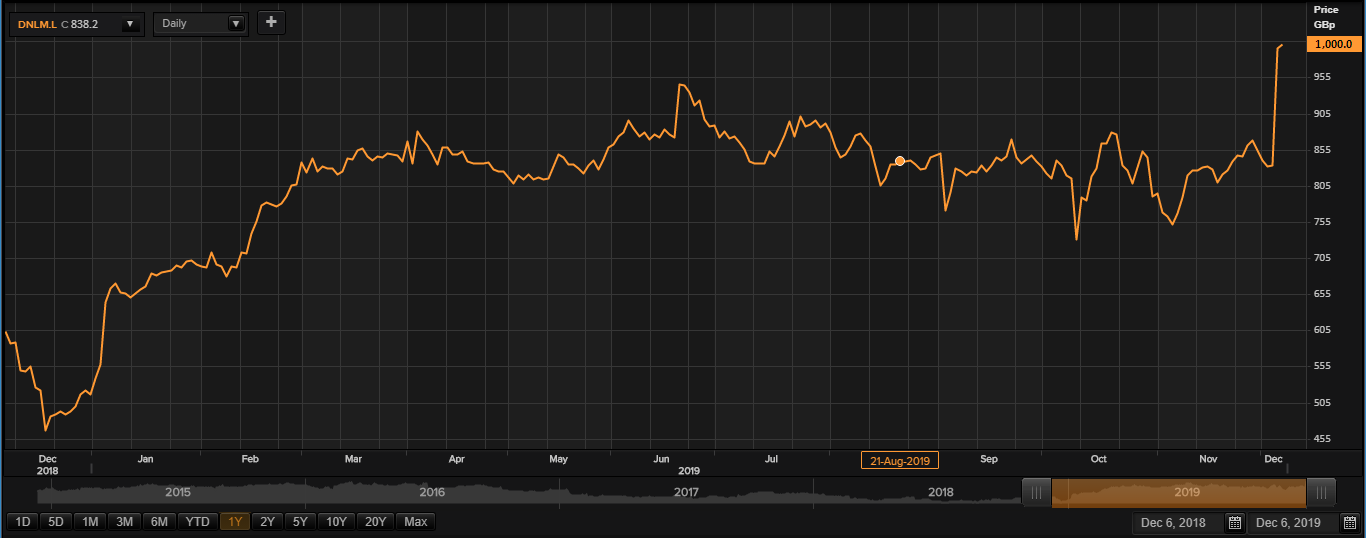
Daily Chart as at Dec-06-19, before the market close (Source: Thomson Reuters)
At the time of writing (before the market close, at 11:48 AM GMT), shares of the Dunelm Group PLC were trading at GBX 1,000 and increased by 0.50 per cent against the previous day closing price. The shares of the company got admission for trading on the London Stock Exchange on 24th October 2006. The total M-cap (market capitalisation) of the company stood at £2 billion.
Daily Traded Volume Summary
The 5-day average daily traded shares, which exchanged hands were recorded at 590,393.20, which was approximately 31.25 per cent more than the 30-day average daily traded shares 449,815.80, which exchanged hands at the LSE (London Stock Exchange). At the time of writing, before the market close, todayâs traded volume of the shares of the company was around 189,088 and number of trades executed stood at 572 at the LSE (London Stock Exchange).
52-week High/Low range
In the past 52 weeks, shares of the Dunelm Group PLC have hovered between a high price level of GBX 1,030.00 (as on 6th December 2019) and a low-price level of GBX 464.60 (as on 18th December 2018). At the current level of trading, as quoted in the price chart, shares traded around 1.08 per cent below the 52-week high and were 115.23 per cent above the 52-week low.
Price Performance (in percentage)
The shares of the Dunelm Group PLC have delivered a positive price return of 65.24 per cent on a Year on Year (YoY), have outperformed the benchmark index, as the benchmark index gave 60.24 per cent positive return over the same period. However, the stock has given a positive price return of approximately 90.89 per cent on a year-to-date (YTD) time frame and was up by approximately 30.49 per cent in the last one month.
Simple Moving Average (SMA)
From the Simple Moving Average standpoint, shares traded above the 30-day simple moving average price. Also, the shares traded above its 60-day and 200-day SMA prices.
Relative Strength Index (RSI)
The RSI indicator for the shares of the company for the 3-days, 9-days and 14-days was recorded at 93.82, 83.21and 76.59, respectively. Also, the stockâs 30-days RSI was recorded at 65.37.
Boohoo Group PLC (LON:BOO)
The United Kingdom domiciled fashion apparel retailing company, Boohoo Group Plc is christened among the top online fashion retail company in the United Kingdom, having a presence outside of the United Kingdom in Europe, Australia and in the United States of America.
Dunelm Group PLC (LON:DNLM)
The UK based general retailer company, Dunelm Group Plc operates in the UK's homeware market. The key brands of the company are Dunelm and Dorma. Dunelm Plc has around 170 physical outlets and a total representative base of approximately 10,000 people.
