


Dow dropped nearly 4.5%, and FTSE 100 plummeted 3.49% on Thursday
The Dow Jones Industrial Average plunged approximately 1,200 points to settle at 25,766.64 on February 27, 2020 (Thursday), which is indicating that investors scary about the deadly Coronavirus impacts which continue to deepen despite some signs of an uptick in the Chinse economy.
- S&P 500 index plummeted 137.63 points or 4.42% to close at 2,978.76, and the technology benchmark, Nasdaq Composite dropped 414.30 points or 4.61% to settle at 8,566.48.
- Asian market too extended their previous sell-off, S&P/ASX 200 declined further by 216.60 points or 3.25% and settled at 6,441.20 (as on Friday trading). Hong Kongâs Hang Sang traded nearly 649 points or 2.42% lower against their previous closes to 26,778.62, and Japanâs Nikkei 225 wiped out 805.27 or 3.27% to close at 21,142.96.
- K. benchmark indices are all set to deepen sell-off as 1st case of Coronavirus got confirmed in Lithuania, Europe. Where a 39-year old woman was diagnosed with Coronavirus symptoms after visiting Verona, Italy
- 1 new Coronavirus case has been confirmed in Canada (Quebec) as on February 28 2020â a woman who has returned back to Montreal from a trip to Iran on a flight from Doha and went to a clinic on February 24tt, 2020, was diagnosed with minor symptoms.
- 1st case in Nigeria, where an Italian citizen working in Nigeria was diagnosed with virus symptoms.
- As per the official announcement on Friday, February 28, 2020, altogether 256 new cases were confirmed in South Korea, and 327 new cases and 44 new deaths were confirmed in China on February 27 by the National Health Commission of China.
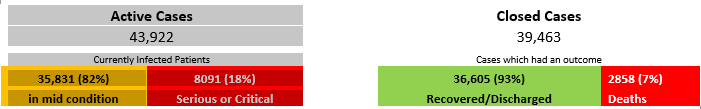
- According to the âworldometer reportâ on February 28, 2020, virus affected confirmed cases rose to nearly 84,000 and death counts surged to around 2,858 and number of patients recovered from this deadly virus stood at 36,605.
Steep Sell-off: Scary numbers
- London's FTSE 100 plummeted nearly 8% on the week to February 27, 2020. Mid-cap gauge FTSE 250 dropped nearly 9% during the period under consideration. Also, broader indices are all set to surpass losses it had witnessed (nearly 12%) last week. As at the time of writing (at 09:14 AM GMT), FTSE 100 dropped nearly 270 points or 3.9% to 6,529.25, and FTSE 250 slumped approximately 830 points or 4.19% to 18,954.58.
- FTSE 100 is at a multi-year low level. As on Friday, February 28, 2020, FTSE 100 tested a level which was last witnessed in December 2018.
- New York Stock Exchangeâs major index S&P 500 plunged more than 10% on the week to February 27, 2020 and are looking set to extend losses further on Friday trading session, mirroring the other global markets. The global technology stocks benchmark index Nasdaq Composite slumped more than 10% during the period under review, and the Dow Jones Industrial Average tumbled more than 11% in week to February 27, 2020 period. Also, steep fall witnessed on the Wallstreet in this week is reportedly the highest since the 2008 financial crisis.
- Japanâs Nikkei tumbled approximately 10% in the week over period to settle on Friday at 21,142.96, Hong Kongâs Hang Sang tanked 4.32% on Week to date (WTD) basis to close the week at 26,129.93, Australia's S&P/ASX 200 dropped nearly 10% on WTD basis to end the last trading week of February 2020 at 6,441.20, and South Koreaâs KOSPI accumulated weekly loss of about 8.5% to end at 1,987.01, respectively.
What to watch for: If sell-off in the U.S. market continues further and Dow breaches the next strong support level of 22,878.92, a level was last seen in December 2018, then it would be a steep bear market, and sell-off could further trigger.
World Equity Indices vs their 200-day SMA
- European major FTSE 100âs Price/200-day SMA at 0.89x, reflects the index is approximately 11% away from its crucial long-term support level of 200-day SMA. Germany's DAX Price/200-day SMA at 0.89, reflects trading 11% below its 200-day SMA. An underlying breaching down its long-term crucial support level of 200-day SMA, typically considered as a bearish market trend and could struggle further.
- United Statesâ major Dow Jones Industrial Average Indexâs Price/200-day SMA ratio at 0.90x, reflects 10% below its 200-day SMA, S&P 500 Price/200-day SMA at 0.92%, approximately 8% away from its 200-day SMA and Nasdaq Compositeâs (on which technology stocks holds higher weightage) Price/200-day SMA at 0.91x, and traded approximately 9% below its crucial long-term support level.
- In Asian markets, Chinaâs Shanghai Compositeâs Price/200-day SMA ratio stood at 0.97x, which reflects a 3% distance from its crucial 200-day SMA, South Korea's KOSPI Price/200-day SMA stood at 0.91, approximately 9% away from its 200-day SMA, Japan's Nikkei 225 Price/200-day SMA stood at 0.90, reflecting a 10% decline from its 200-day SMA, and India's NIFTY 50 Price/200-day SMA ratio stood at 0.93x, reflecting 7% deviation from its 200-day crucial support level.
- The above analysis reflects that the equity market across the world traded below their long-term support level of 200-day simple moving average, which is a steep bearish trend.
Takeaway From the Discussion
- 10-Year U.S. Treasury Bond registered a record low yield of 1.163% on Friday, as it slumped approximately 6.62% and extended losses for the seventh straight day. The plunging yield is signalling that investors are ditching risky assets and shifting to safe-haven U.S. Treasury Bonds and gold. Typically, during a market downtrend investor look out for safer assets like bonds, which drives bondâs prices up and yields lower. A year-over period, the 10-year yield was more than 2.6%.
- United Kingdom 10-year Bond Yield slumped 9.66% to 0.425% for the day.
