


The stock market is always vulnerable to uncertainties and in the given scenario in the UK lately, any high vulnerability can sway investors away from the markets. Before we make an opinion about investing in the present time, we should acknowledge the fact that during the turbulent period, more people tend to make money in comparison to the growth period.
In case of a market crash, the large-cap stocks tend to fall less due to their higher weightage in the index and generally being fundamentally strong as compared to mid or small-cap stocks. Here we have analysed five large-cap stocks on the basis of regular income generation and year to date returns. These stocks are major constituents of FTSE 100 index traded on the London Stock Exchange. These are Persimmon PLC, SSE PLC, Taylor Wimpey PLC, British American Tobacco PLC and National Grid PLC. Below is a comparative price chart of these stocks.
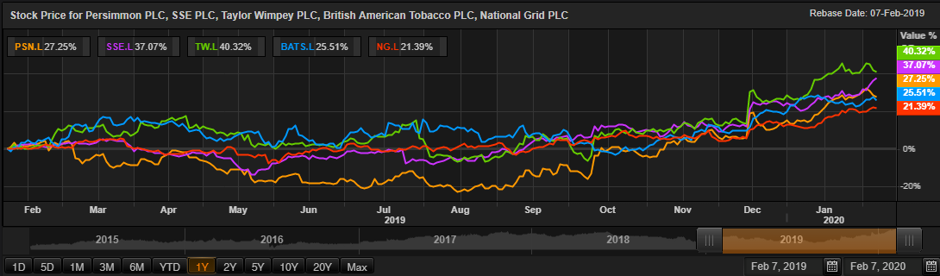
(Source: Thomson Reuters)
Persimmon PLCÂ
Persimmon PLC (LON:PSN) is a leading housebuilder of Britain, it designs, develops and builds residential houses, ranging from studio apartments to executive-style family homes. The company has 31 regional offices in the UK, and it trades under the brands such as Charles Church, Persimmon Homes and Westbury Partnerships across England, Wales and Scotland.
Recent trading performance of Persimmon PLC for FY19Â
According to companyâs trading update of FY19, the companyâs total revenues decreased by 2.4% to £3.65 billion against the last year revenues of £3.74 billion. In new housing, the revenues for 2019 stood at £3.42 billion, a decrease of 3.5% from the previous year revenue of £3.55 billion. The companyâs cash generation remains solid; the cash balances stood at £844 million as on 31st December 2019.
Persimmon -Stock price performance
On 7th February 2020, at the time of writing (before market close, GMT 2:55 PM), Persimmon PLC shares were trading at GBX 3,026. Stock's 52 weeks High and Low is GBX 3,201.00/GBX 1,802.50. Stockâs average traded volume for 5 days was 1,481,820.80; 30 days - 1,066,321.10 and 90 days - 1,354,209.63. The average traded volume for 5 days was up by 38.97% as compared to 30 days average traded volume. The companyâs stock beta was 0.89, reflecting lower volatility as compared to the benchmark index. The outstanding market capitalisation was around £9.78 billion, with a dividend yield of 7.7%. Furthermore, the YTD return of the stock was around 13.21%.
SSE Plc
SSE Plc (LON:SSE) is a Scotland based energy production and distribution company. It has a combined electricity generation portfolio from both non-renewable and renewable resources. The company is also engaged in the natural gas exploration and production, gas storage, energy contracting, telecommunication and retail electricity connection and metering activities.
Recent trading performance of SSE Plc
As reported by the Group in its trading Statement for third quarter of 2020, for the period ended on 31st December 2019. The company shall continue to execute its five-year dividend plan to March 2023 and in-line with an expected dividend of 80 pence per share for the fiscal year 2020. SSE expects its adjusted earnings per share (EPS) to be in the range of 83 pence to 88 pence. During the first nine months of the fiscal year 2020, the output of renewable energy was over 5% behind schedule. The companyâs performance was in line with the expectations as announced in its interim results.
SSE -Stock price performance
On 7th February 2020, at the time of writing (before market close, GMT 3:09 PM), SSE Plc shares were trading at GBX 1,612.5. Stock's 52 weeks High and Low is GBX 1,615.00/GBX 997.80. Stockâs average traded volume for 5 days was 4,223,461.00; 30 days - 3,180,260.00 and 90 days - 3,420,629.20. The average traded volume for 5 days was up by 32.80% as compared to 30 days average traded volume. The companyâs stock beta was 0.68, reflecting lower volatility as compared to the benchmark index. The outstanding market capitalisation was around £16.52 billion, with a dividend yield of 5.79%. Furthermore, the YTD return of the stock was around 10.71 %.
Taylor Wimpey PLC
Taylor Wimpey PLC (LON: TW.) is a residential housing developer based in the UK. The company has operations at a regional level, and it operates from 24 local offices all over the country. It builds a wide array of properties and is recognised as one of the United Kingdomâs largest residential developers. The groupâs operations are differentiated in two segments: Housing Spain and the Housing United Kingdom. The Housing United Kingdom division is then further divided into London and South East (including Central London) Central and South West, North, and Corporate.
Recent trading performance of Taylor Wimpey PLC
The company announced a trading update for FY19 period ended 31st December 2019. In 2019, the total home completions, including joint ventures, increased by around 5% to 15,719 as compared with the corresponding period of the last year (2018: 14,933). The company delivered 3,548 affordable homes (including joint ventures). At the end of 2019, the total order book, excluding joint ventures, increased to £2,176 million against the same period last year. At the year ended 2019, the company had a robust net cash balance of £546 million, driven by the timing of certain land investments.
Taylor Wimpey PLC -Stock price performance
On 7th February 2020, at the time of writing (before market close, GMT 3:13 PM), Taylor Wimpey PLC shares were trading at GBX 216.10. Stock's 52 weeks High and Low is GBX 228.00 /GBX 141.70. Stockâs average traded volume for 5 days was 12,374,869.40; 30 days - 10,684,001.97 and 90 days - 14,087,665.19. The average traded volume for 5 days was up by 15.83% as compared to 30 days average traded volume. The companyâs stock beta was 0.94, reflecting almost similar volatility as compared to the benchmark index. The outstanding market capitalisation was around £7.19 billion, with a dividend yield of 3.51%. Furthermore, the YTD return of the stock was around 12.56 %.
British American Tobacco PLC
United Kingdom-headquartered multinational tobacco and next-generation products company, British American Tobacco PLC (LON:BATS) operates in four geographical segments namely, the United States (US), Europe and North Africa (ENA), Americas and Sub-Saharan Africa (AMSSA) and Asia-Pacific and Middle East (APME).
Recent trading performance of British American Tobacco PLC
In the second half of 2019, the group expects an increase in revenue in the new categories. In the financial year 2019, it expects the new category revenue development at the lower end of the range of 30%-50% at constant currency, reflecting the slowdown in the United States vapour market.
The full-year 2019 adjusted revenue growth is expected at the upper half of the 3%-5% range at constant currency. On an adjusted basis, the FY2019 operating margin is likely to increase in the range of 50-100 basis points.
On a constant currency basis, the adjusted diluted earnings per share are expected to increase by high single-digit in FY19, with a currency translation tailwind of approximately 1.2 per cent, and a headwind of approximately 2 per cent for 2020.
British American Tobacco PLC-Stock price performance
On 7th February 2020, at the time of writing (before market close, GMT 3:17 PM), British American Tobacco PLC shares were trading at GBX 3,432.50. Stock's 52 weeks High and Low is GBX 3,507.00 /GBX 2,249.00. Stockâs average traded volume for 5 days was 3,573,975.20; 30 days - 3,134,553.30 and 90 days - 3,241,310.47. The average traded volume for 5 days was up by 14.02% as compared to 30 days average traded volume. The companyâs stock beta was 1.38, reflecting higher volatility as compared to the benchmark index. The outstanding market capitalisation was around £80.31 billion, with a dividend yield of 5.83%. Furthermore, the YTD return of the stock was around 7.74%.
National Grid PLC
United Kingdom-based global electricity and gas company, National Grid Plc (LON:NG) is engaged in the transmission and distribution of electricity and gas. The company operates in the US, the UK and North Eastern countries.
Recent trading performance of National Grid PLC
The companyâs underlying operating profit grew by 1 per cent to GBP 1.3 billion due to an increase in US Regulated profits, for the first half of the fiscal year 2020. Underlying EPS of the company increased by 2 per cent to 20p due to a US tax settlement relating to prior periods. The company declared a dividend of 16.57p per share in the first half of FY20. The companyâs capital investment increased by 28 per cent to GBP 2.72 billion due to an increase in US capital spending.
National Grid PLC-Stock price performance
On 7th February 2020, at the time of writing (before market close, GMT 3:19 PM), National Grid PLC shares were trading at GBX 1,025. Stock's 52 weeks High and Low is GBX 1,033.14 /GBX 772.50. Stockâs average traded volume for 5 days was 6,828,395.80; 30 days - 5,505,613.47 and 90 days - 6,784,192.01. The average traded volume for 5 days was up by 24.03% as compared to 30 days average traded volume. The companyâs stock beta was 0.70, reflecting lower volatility as compared to the benchmark index. The outstanding market capitalisation was around £36.27 billion, with a dividend yield of 4.65%. Furthermore, the YTD return of the stock was around 8.86%.
