


The FTSE Indices have given a decent performance during the majority of the past one year despite the very dismal economic outlook of all other macroeconomic parameters in the United Kingdom. This has baffled many an observer who are witnessing many a traditional correlation between the FTSE Index and select economic parameters fall apart. However, as the Brexit D day of 31 October 2019 approaches, the indices have started to perform poorer.
The FTSE indices, representative of the largest number of companies in the United Kingdom, in terms of revenues and market capitalization, is seen as the barometer of the British economy. The FTSE All share index along with its subsets, the FTSE 100 and FTSE 250 indexes are studied by economists, debt market makers, stock market professionals and researchers alike to carefully consider the implications of any unwarranted movements in the macroeconomic parameters of the British economy on these indices. However, with the impact of the uncertainties posed by Brexit on the macro economic environment prevailing in United Kingdom, it seems that it has broken down every relationship the index had with other economically important parameters e.g. currency exchange rate movement, unemployment rate and consumer confidence to name a few.
Impact of Brexit on the British pound Sterling; With or without a deal, Brexit will put the British economy in an adverse balance of payment situation. Under the European union treaty, to which United Kingdom was signatory, a country exiting the union must compensate the union of its obligations for a certain future period, which in the instant case of United Kingdom leaving the European Union comes to around £ 32.8 billion which will make the British currency weaker via-a- vis other major currencies for an extended period of time.
However, a fall in currency value is not always bad news. Whenever there is a weakness in the countryâs currency it is a boon period for the exporters. The event signals a high earning period for the exporters of that country as well as other businesses in it who are dependent on these exporters. A complimentary effect of this heightened business activity would cause businesses to borrow more money to fund their expanded business activities, which will in turn put upward pressure on the currency thereby pushing up its demand and value. This is a cycle that goes on in any economy unless it is impacted by some major economic phenomenon, which puts the whole arrangement into disarray. Among such phenomenal forces are, government intervention to control exchange rates, war, severe natural calamity or a politico-economic event like Brexit.
Both the European Union and Great Britain are in battle mode to deal with this mega event of mutual parting of ways. There is greater emphasis on measures to be taken to prevent business disruptions from happening at all. Despite getting two yearsâ preparation time to take all preventive measures, the exercise seems to have overwhelmed the foresight of both European Union and Great Britain. With the gradual ensuing of clarity of the magnitude of the problem, lawmakers on both sides are grappling for solutions. The solution was to arrive at an agreement (Deal) between the two blocks such that in case of any eventuality, all outstanding issues would be resolved as per a predetermined set of terms and conditions to be frozen under this agreement. However, negotiations between European Union and Great Britain are still going even as the final date of disengagement is coming near.
The recent good performance of the FTSE index in the run up to Brexit is on account of domestic factors and the weakening of the Pound Sterling which in the short run is helping the export-oriented companies. However, as the D-day for the Brexit event comes closer, fear or anxiety has started to grip the markets which is taking its toll on the index values. Dissecting the performance of some of the Major Indices which are representative of the London Stock Exchange, the FTSE 100, the FTSE All share and the FTSE AIM All Share indices have delivered a poorer performance compared to FTSE 250 and which has had a relatively better performance.
Below is an analysis of the four Indices over the past one-year period.
Performance of the FTSE 100 Index.
The FTSE 100 index which represents the top 100 of the listed companies on the London Stock Exchange in terms of the Market Capitalization than any other Index maintained by the FTSE Russell company. This index at any point in time represents more than 80 per cent of the market capitalization of the London Stock exchange.
The Index was performing well during the major part of the year but has been trending lower since the beginning of August 2019. The 52-week price change witnessed by the index during the period was -3.54 per cent. The 52-week highest index value recorded was 7,727.49. The 52 week lowest index value recorded was 6536.53.
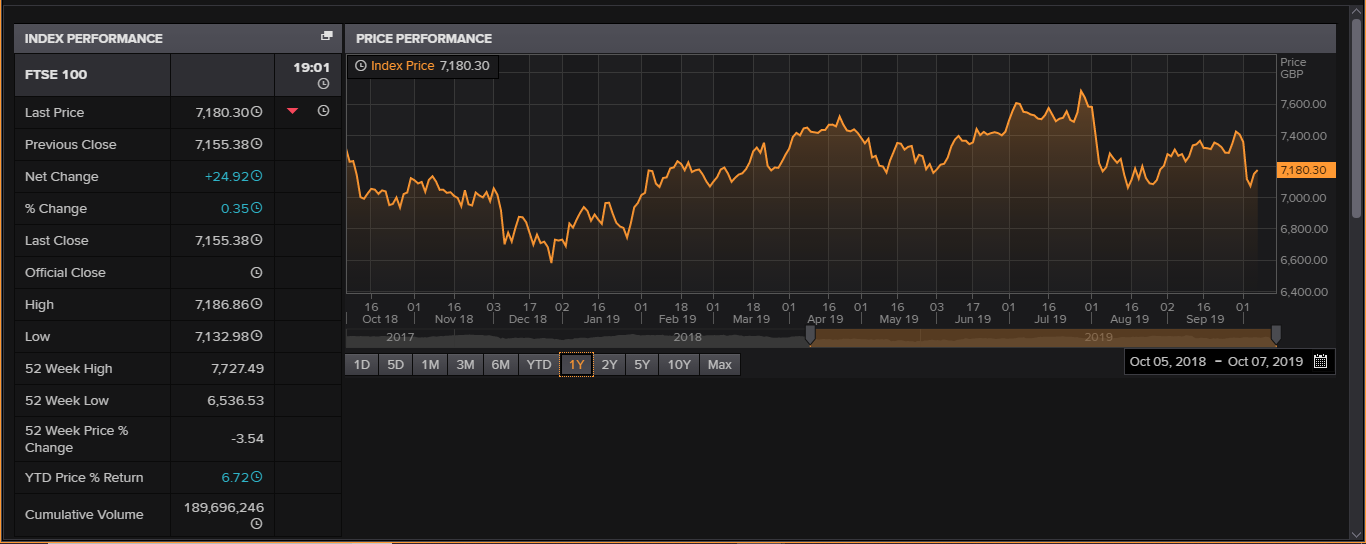
The total market capitalization of this index as on 7 October 2019 was about £1.80 Trillion (source: Thomson Reuters).
Performance of the FTSE All share Index.
The FTSE All share index which represents largest number of listed shares on the London Stock Exchange than any other Index maintained by the FTSE Russell company. This index has the largest market capitalization value compared to any other FTSE group index.
The Index has given a good performance in the past year till the beginning of August 2019 but has declined after that. The 52-week price change witnessed by the index during the period was -3.56 per cent. The 52-week highest index value recorded was 4,205.74. The 52 week lowest index value recorded was 3,573.33.
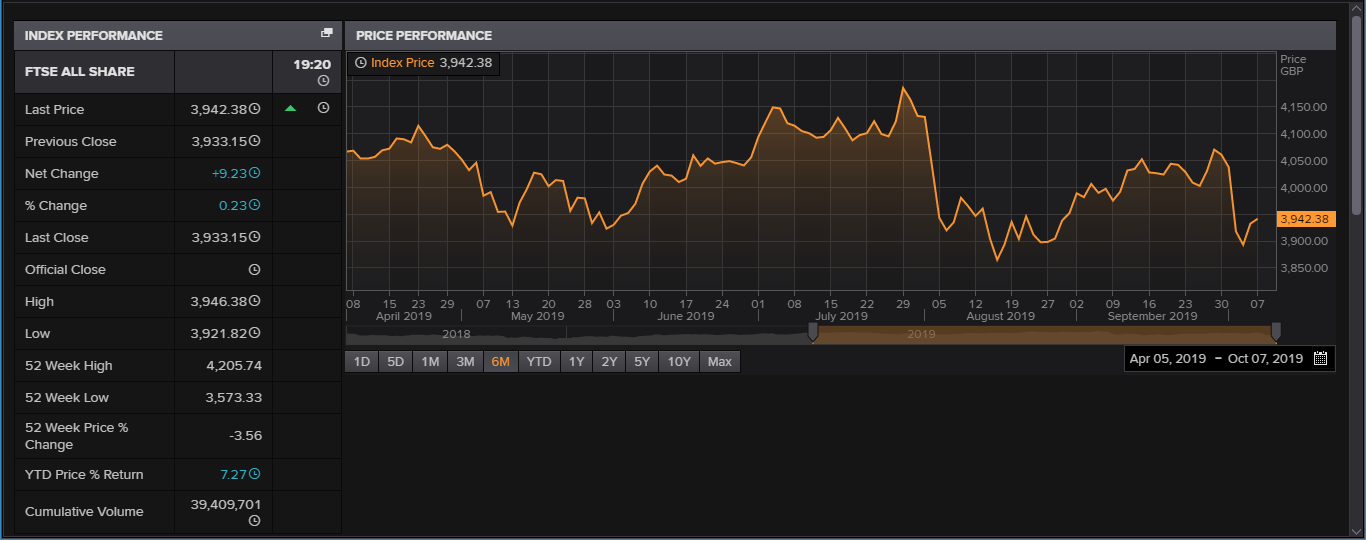
The total market capitalization of this index as on 7 October 2019 was about £2.24 Trillion (source: Thomson Reuters).
Performance of the FTSE AIM All share Index.
The FTSE AIM All share index represents all companies listed on the Alternative Investment Management segment (AIM) of the London Stock Exchange which meet the criteria of liquidity and free float of the Exchange.
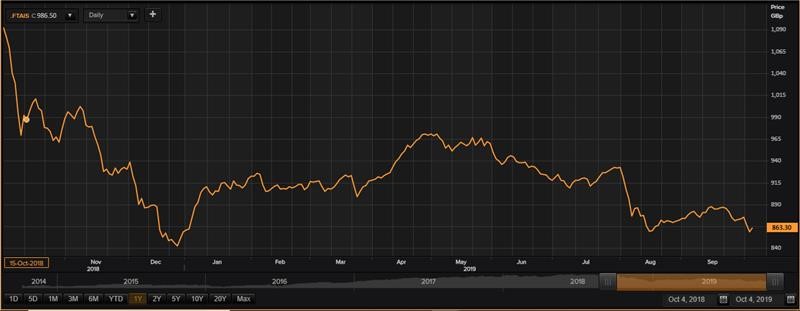
The above performance of the Index is between the period of October 2018 to October 2019 (source: Thomson Reuters).
Performance of the FTSE 250 Index.
The FTSE 250 index represents the 101st company to 350th largest companies in terms of diminishing value of Market capitalization listed on the London Stock Exchange. This Index is sometimes seen as a reflection of the United Kingdom economy as it represents mostly domestic companies with a good mix from all sectors.
The Index has given a relatively better performance during the previous year to 7 October 2019. The 52-week price change witnessed by the index during the period was -3.03 per cent. The 52-week highest index value recorded was 20,230.10. The 52-week lowest index value recorded was 17,054.72.
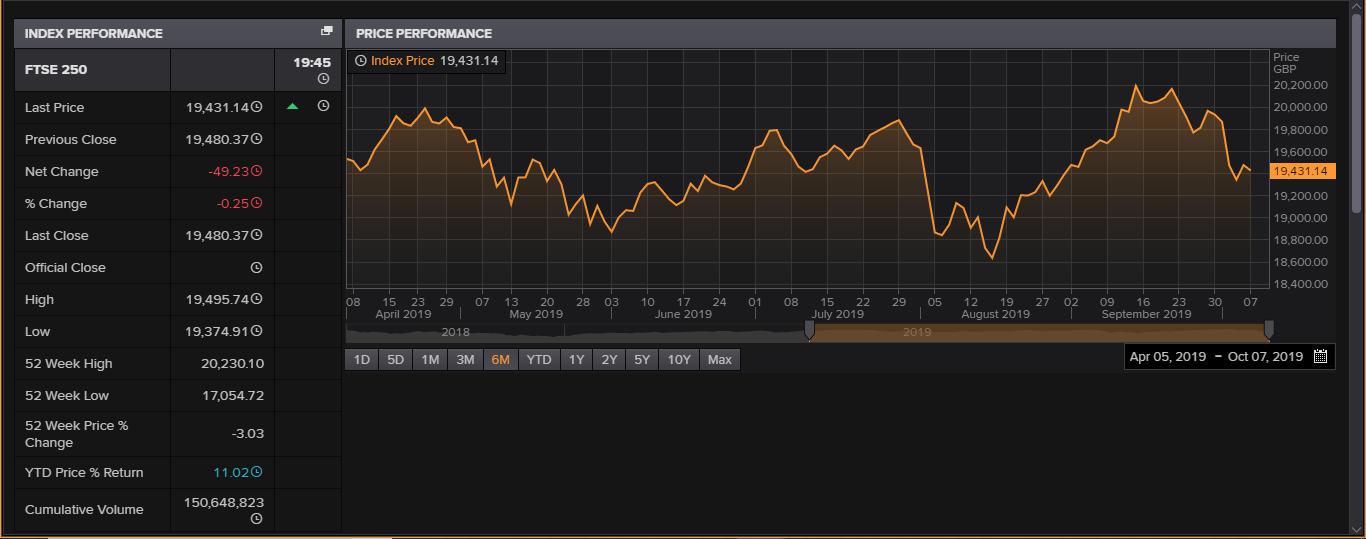
The total market capitalization of this index as on 7 October 2019 was about £361.12 billion (source: Thomson Reuters).
