AUS
AUS
 NZ
NZ
 UK
UK
 CA
CA
 USA
USA
 IND
IND







Summary
- Shopify’s stocks declined by over 13 per cent on the back of Pfizer’s vaccine update on Monday. However, the tech stock recovered more than 7 per cent the next day.
- Stocks of Shopify’s have soared about 139 per cent year-to-date.
- Open Text’s stock experienced a slight fall on the back of Pfizer’s vaccine update, but the cloud stock completely recovered on November 10.
- Open Text Corp recorded revenues of US$341 million from cloud services and subscription in Q1 FY2021, an increase of 43.7 per cent year-over-year (YoY).
Tech stocks have been on a roller coaster ride since Pfizer and BioNTech announced 90 per cent success of their COVID-19 vaccine on November 9. As investors keenly await more clarity on the vaccine front, S&P/TSX Capped Information Technology Index doffed 2.19 per cent on Thursday, November 12. However, the index is up 3.46 per cent month-to-date and has advanced by 34.69 per cent year-to-date at the time of filing this story.
Let us have a look at the Toronto Stock Exchange (TSX) listed two large cap stocks that have also started recovering from a short-span of sell-off: Shopify Inc. (TSX:SHOP), and Open Text Corporation (TSX:OTEX).
Shopify Inc. (TSX:SHOP)
Shopify Inc, Canada’s one of the leading e-commerce platforms, cruised through the coronavirus pandemic crisis with profits. Since the March market crash, the stock price has surged nearly 170 per cent. The largecap stock has soared 135 per cent year-to-date.
Shopify fell by over 13 per cent on the back of Pfizer’s vaccine update. However, the tech stock rebounded more than 7 per cent on November 10. It is trading flat month-to-date.
Stocks of Shopify recorded its highest peak (C$ 1487 per share) on September 2 but tumbled during the tech sell-off in the wake of COVID-19 vaccine success news.
Its current market cap stands at C$ 136 billion. The tech giant’s price-to-book (P/B) ratio is 8.77, and the debt-to-equity(D/E) ratio is 0.15. Its current price-to-cashflow is 464.20, as per the TMX Money website.
The stock delivers a positive return-on-equity (ROE) and a positive return on assets (ROA), 4.37 per cent and 3.69 per cent, respectively. Its current earnings per share stand at C$ 2.20.
Shopify’s Financial Highlights
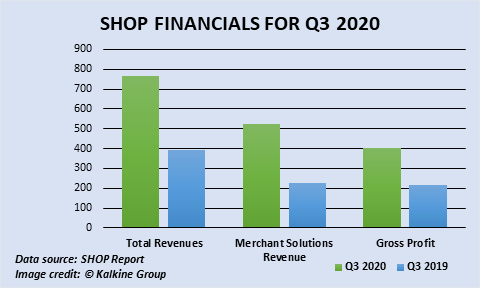
In the third quarter of 2020, Shopify’s revenue from subscription solutions increased by 48 per cent YoY to US$245.3 million, mainly due to many retailers signing up on the Shopify platform and leveraging to extend its reach to consumers. Shopify’s vendor solutions revenue soared 132 per cent to US$522.1 million, led by gains in Gross Merchandise Volume (GMV). The tech company reported a net income of US$191.1 million in the quarter, up from net loss of US$72.8 million in Q3 2019.
The e-commerce company posted revenue of US$767.4 million, a 96 per cent year-over-year growth. Shopify’s gross profit increased by 87 per cent to US$405.1 million in the third quarter of 2020, and its operating income was at US$50.6 million (7 per cent of revenue). In the third quarter of 2019, the company registered an operating loss of US$35.7 million.
Shopify currently trading at C$ 1213.83.
Open Text Corporation (TSX:OTEX)
Open Text’s stock also dropped on the back of Pfizer’s vaccine update, but the software stock bounced back on November 10.
OpenText is a cloud-based service provider that generates its revenue from its subscriptions to corporations and the remote workforce.
Its stock price has soared over 28 per cent since the COVID-19 pandemic-led market crash on March 24. However, the largecap software stock recorded a nearly 4 per cent decline year-to-date.
Its current market cap is C$ 14.92 billion. The tech stock’s price-to-book (P/B) ratio is 2.821, and the debt-to-equity(D/E) ratio is 1.10. Its current price-to-cashflow is 10.60, as per the TMX Money website.
The stock offers a positive return-on-equity (ROE) and a positive return on assets (ROA), 6.60 per cent and 2.90 per cent, respectively. Its current earnings per share stand at C$ 1.25.
The company approved a cash dividend of US$ 0.201 per share for this month, which is payable on December 22, 2020. The tech stock holds a current dividend yield of 1.925 per cent. Its three-year dividend growth is 11.21 per cent and the five-year dividend growth stands at 13.17 per cent.
Open Text Corp Financial Highlights
In the first quarter for the fiscal year 2021, Open Text Corp reported total revenue of US$804 million, increased from the first quarter of FY2020.
The tech company recorded revenues of US$341 million from cloud services and subscription in Q1 FY2021, an increase of 43.7 per cent year-over-year (YoY). Its net income grew to US$103.4 million in Q1 FY2021, soared from US$74.4 million in Q1 FY20.
The company registered an adjusted EBITDA of US$342.3 million in Q1 FY21, a 34.7 per cent surge YoY. The software company reported cash and cash equivalents of US$1.85 billion as of September 30.