


Highlights
- Canada equity activity reflected broad sector strength across Toronto trading.
- Materials, clean technology, and technology groupings guided overall market direction.
- Market breadth indicated widespread participation among listed issuers.
Toronto trading reflected coordinated sector strength, with materials, clean technology, and technology listings guiding overall direction while benchmark indices illustrated broad based exchange participation.
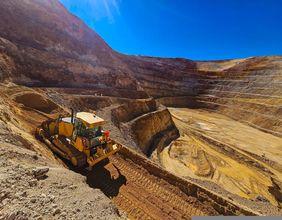
Canada equity markets concluded the trading session with upward movement across major categories, reflecting coordinated sector activity and exchange wide participation. The materials, clean technology, and information technology spaces contributed to this environment, while First Majestic Silver Corp. (TSX:AG) appeared among the issuers drawing notable market attention during the session.
What factors shaped overall movement across Toronto listed shares?
Trading on the Toronto exchange reflected a coordinated advance influenced by sector alignment rather than isolated developments. Activity within materials related businesses supported broader exchange performance, while renewable energy and clean technology entities added to momentum through aligned participation. Information technology related issuers also demonstrated collective movement, reinforcing the overall direction observed at the session close. Market breadth showed advancing listings outpacing declining ones, illustrating participation across a wide portion of the exchange.
How did materials and resource focused sectors contribute?
Materials oriented listings played a central role in shaping exchange conditions. Companies associated with metals and resource extraction reflected strong engagement, which influenced sector benchmarks tied to commodities exposure. This alignment supported the broader tone across Toronto trading, as materials activity often carries interconnected effects through supply chains and related industrial categories. The session highlighted how coordinated movement within this area can influence overall exchange sentiment.
Why did clean technology and renewable energy remain in focus?
Renewable energy and clean technology listings maintained visibility due to continued sector engagement and alignment with broader economic themes. Trading reflected consistent participation rather than isolated movements, supporting index level direction tied to sustainability related businesses. This activity underscored the role of environmentally focused technologies as a recurring component within Canadian equity markets.
What role did information technology shares play during the session?
Information technology listings contributed positively through coordinated sector behavior. Engagement across software, digital services, and infrastructure related issuers added balance to market movement, complementing strength seen in resource and clean technology areas. This cross sector participation reflected diversified drivers rather than reliance on a single category.
How did market breadth reflect overall participation?
Market breadth indicated advancing shares exceeding declining ones, highlighting broad based engagement across the exchange. Such breadth often reflects distributed trading activity rather than concentration within limited segments. Listings that remained unchanged further illustrated a stable trading environment alongside the observed upward movement.
Which benchmark indices framed the session context?
Benchmark measures provided structural context for the trading session. The S and P / TSX Composite Index (TXCX) served as a broad indicator of overall market direction, while sector specific measures reflected underlying activity within defined categories. Complementary benchmarks such as the S and P / TSX 60 and the TSX Venture Composite Index further illustrated conditions across different capitalization groupings.
How did smaller capitalization segments align with broader trends?
Smaller capitalization listings displayed alignment with the broader exchange direction, reflecting participation beyond large established entities. Benchmarks such as the TSX Smallcap Index (TXTW) and the TSX Completion Index (TXFO) contextualized activity among developing and mid range issuers. This alignment suggested that exchange movement extended across capitalization categories rather than remaining concentrated.
What insights emerged from dividend focused benchmarks?
Dividend oriented benchmarks offered additional perspective on trading behavior. The TSX Composite Dividend Index (TXDC) reflected activity among issuers recognized for distribution characteristics, complementing insights from growth and resource focused measures. Together, these benchmarks illustrated the multi dimensional nature of the session.
