


Highlights:
OceanaGold Corporation operates in the materials sector, focused on gold mining and exploration.
The company’s financial reporting reflects updates on profit margins and asset management.
Operational data continues to shape ongoing attention toward the company’s structure and returns.
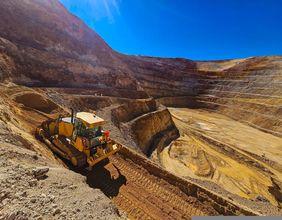
OceanaGold Corporation (TSX:OGC) is a mining company active within the materials sector, with operations primarily focused on gold extraction and exploration. As a listed entity on the Toronto Stock Exchange (TSX), it is tracked within the S&P/TSX Composite Index (Txcx) and the TSX Completion Index (Txfo). The company’s role in precious metals production places it among the extractive industry entities that are part of Canada's broader resource economy.
Review of Return and Margin Metrics
Recent financial reporting shows updated data regarding returns on equity and profit margins. These figures reflect the company’s handling of capital in relation to its earnings from operations. The metrics serve to illustrate the efficiency of resource use within the business framework, as part of the broader financial documentation presented in corporate reports.
Performance ratios continue to reflect how the business manages production activities and related costs across its asset base. These financial values remain key components of understanding the company’s operating environment, especially within the competitive framework of the global mining industry.
Equity Structure and Asset Management
Updates to the company’s balance sheet reveal changes in total equity and tangible asset positioning. Adjustments in these areas correspond to corporate actions and operational scale, impacting how capital is distributed within the company. The structure of equity and its relation to total asset value forms a crucial aspect of financial reporting for entities in the materials sector.
As part of its regulatory responsibilities, the company discloses shifts in its asset base, which include real and intangible resources. The resulting values shape how the company is viewed in terms of resource allocation and ownership transparency, all within TSX listing standards.
Profit Allocation and Cost Trends
Net income figures show how profits are allocated across the organization and how they translate into earnings per equity unit. Fluctuations in operating costs, capital expenditures, and other expense categories contribute to this outcome. These trends are monitored by entities tracking corporate profitability across the sector.
Margins and operational efficiency play a central role in understanding how the company performs in a cost-sensitive environment such as mining. The company’s ability to manage overhead and production-related costs is reflected in the available figures.
Ongoing Financial Disclosures and Market Visibility
OceanaGold Corporation continues to release its financial documentation in line with its listing requirements. These filings maintain transparency regarding the company’s performance and structural composition. The financial data released provides insight into return rates, margin structures, and asset levels, offering a view into internal operations over the reported period.
As a participant in the TSX, the company’s visibility remains connected to its ability to communicate operational updates and maintain adherence to regulatory standards. These ongoing disclosures are part of its presence across tracked indexes, where mining and materials companies form a critical part of index composition.
