


Highlights
- Worley’s FY25 revenue increased 4% YoY to AUD 12,050 million.
- Sustainability-related activities contributed to 60% of the company’s revenue in FY25.
- The company was appointed by Rio Tinto for EPCM services on the BS1 project.
Worley Limited (ASX:WOR) provides engineering design and project execution services, along with maintenance, reliability, and consulting support, primarily to the energy, chemical, and resource industries.
Financial Update
For the financial year 2025 (FY25), the company reported aggregated revenue of AUD 12.05 billion, up 4% YoY from AUD 11.61 billion in FY24. This growth was supported by higher bookings of AUD 17.1 billion, an expanding backlog of AUD 16.9 billion, and contributions across the energy, chemicals, and resources sectors. Underlying EBITA increased by 19% YoY to AUD 823 million in FY25 from AUD 693 million in FY24, driven by higher-margin professional services, disciplined project execution, and cost efficiency, with normalised cash conversion at 94.9% YoY. During the same period NPATA rose by 29% YoY, reaching AUD 475 million compared to AUD 367 million in the previous year.
Business Update
On 20 November 2025, Chair John Grill highlighted the company’s resilience, focusing on safety, sustainability, and disciplined execution. For FY25 the Board declared a 50-cent per share dividend and approved an AUD 269 million share buyback. Sustainability accounted for 60% of revenue. CEO Chris Ashton outlined a strategy to strengthen, expand, and innovate, with investments in digital, AI, and major projects including LNG and critical minerals.
On 27 October 2025, the company was appointed by Rio Tinto to deliver EPCM services for the Brockman Syncline 1 iron ore project in Western Australia, covering a new primary crusher, conveyor, non-process infrastructure, and a temporary camp.
Key Positives and Negatives
In FY25, the company’s gross margin increased to 8.3% YoY from 7.7% YoY in FY24, while the net margin rose to 3.8% YoY from 2.7% in FY24. The asset turnover ratio declined to 1.04x in FY25 from 1.12x in FY24, and the debt-to-equity ratio increased to 0.43x from 0.38x in FY24.
Business Outlook
For FY26, WOR anticipates higher revenue and underlying EBITA, supported by a backlog, disciplined project execution, and cost efficiency. Margins, excluding procurement, are expected to range between 9.0% and 9.5%. FY26 earnings are projected to be weighted more towards the second half of the year due to non-material project cancellations, capability repositioning, and one-off costs, positioning the company for sustained operational efficiency and growth.
The company also plans to continue adopting AI and digital tools to enhance productivity, reduce rework, and improve project outcomes, thereby increasing workforce efficiency and delivering greater value to customers.
Share Performance of WOR
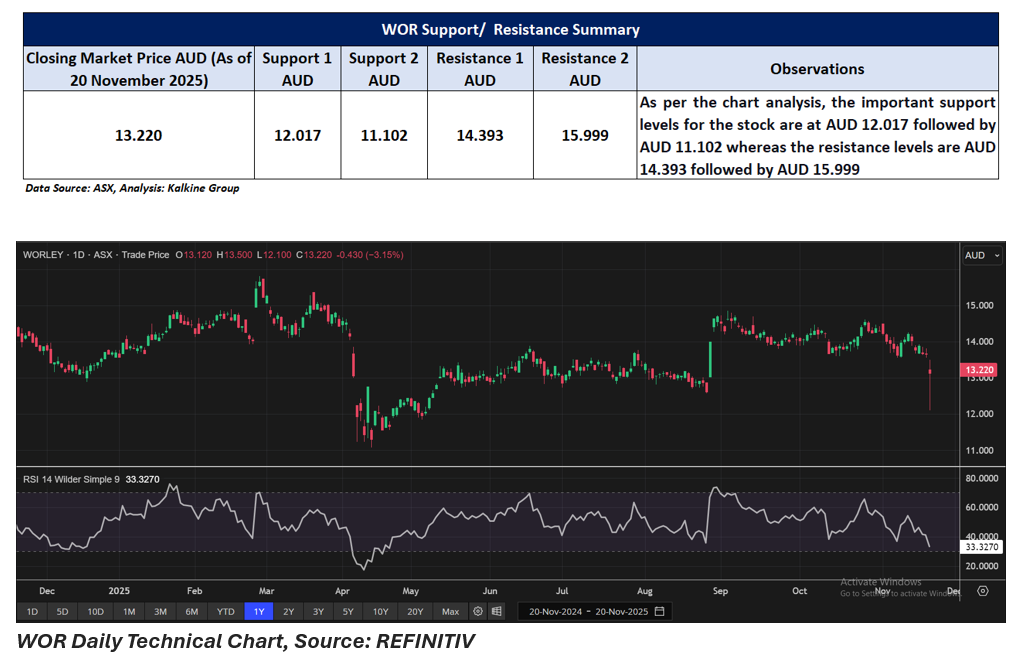
WOR’s shares were trading at AUD 13.22 per share on 20 November 2025 with an intraday loss of 3.15%. WOR’s stock has increased by 2.40% in the last three months, 1.77% over the six months and decreased by 6.7% over the past year. WOR’s 52-week high is AUD 15.81, recorded on 27 February 2025, and 52-week low is AUD 11.070, recorded on 11 April 2025.
Support and Resistance Summary
Note 1: Past performance is neither an Indicator nor a guarantee of future performance.
Note 2: The reference date for all price data, and currency, is 20 November 2025. The reference data in this report has been partly sourced from EODHD/Others.
Technical Indicators Defined:
Support: A level at which the stock prices tend to find support if they are falling, and a downtrend may take a pause backed by demand or buying interest. Support 1 refers to the nearby support level for the stock and if the price breaches the level, then Support 2 may act as the crucial support level for the stock.
Resistance: A level at which the stock prices tend to find resistance when they are rising, and an uptrend may take a pause due to profit booking or selling interest. Resistance 1 refers to the nearby resistance level for the stock and if the price surpasses the level, then Resistance 2 may act as the crucial resistance level for the stock.
Disclaimer
This article has been prepared by Kalkine Media, echoed on the website kalkinemedia.com/au and associated pages, based on the information obtained and collated from the subscription reports prepared by Kalkine Pty. Ltd. [ABN 34 154 808 312; AFSL no. 425376] on Kalkine.com.au (and associated pages). The principal purpose of the content is to provide factual information only for educational purposes. None of the content in this article, including any news, quotes, information, data, text, reports, ratings, opinions, images, photos, graphics, graphs, charts, animations, and video is or is intended to be, advisory in nature. The content does not contain or imply any recommendation or opinion intended to influence your financial decisions, including but not limited to, in respect of any particular security, transaction, or investment strategy, and must not be relied upon by you as such. The content is provided without any express or implied warranties of any kind. Kalkine Media, and its related bodies corporate, agents, and employees (Kalkine Group) cannot and do not warrant the accuracy, completeness, timeliness, merchantability, or fitness for a particular purpose of the content or the website, and to the extent permitted by law, Kalkine Group hereby disclaims any and all such express or implied warranties. Kalkine Group shall NOT be held liable for any investment or trading losses you may incur by using the information shared on our website.
