


Highlights
- Autosports Group Limited (ASX:ASG) shares hit a fresh 52-week high of AU$ 2.420 on Wednesday
- The stock is up nearly 15% on a YTD basis
- ASG share price is forming a negative divergence relative to the 14-period RSI on the daily chart
Shares of Autosports Group Limited (ASX:ASG), which sells new and used motor vehicles and deals in aftermarket products and spare parts, hit a fresh 52-week high of AU$ 2.420 on Wednesday before closing today's trading session on a flat note at AU$ 2.330. ASG shares broke their previous 52-week of AU$ 2.370 hit on Monday, 24 April. The stock has risen nearly 5% over the last five trading sessions, and on a year-to-date (YTD) basis, the stock is up nearly 15%.
For the half year ended 31 December 2022, Autosports' net profit after tax jumped by 71% annually to AU$ 35.1 million, and the company increased its interim dividend by 29% to 9 cents per share, which was fully franked. Continued organic growth and accretive growth from the company's strategically aligned acquisitions helped the company achieve these results, said Autosports Group CEO Nick Pagent, commenting on the 1HFY23 results.
Without providing any numbers, Mr Pagent said the second half of the current fiscal is going to witness the same growth momentum led by strategic acquisitions made over the last one year. “The opening of the Ringwood BMW and Motorrad greenfield site will supplement organic growth through FY2024," Mr Pagent added.
Let’s study the technical chart of ASG to know where the stock is heading in the near term.
ASG’s Technical Analysis:
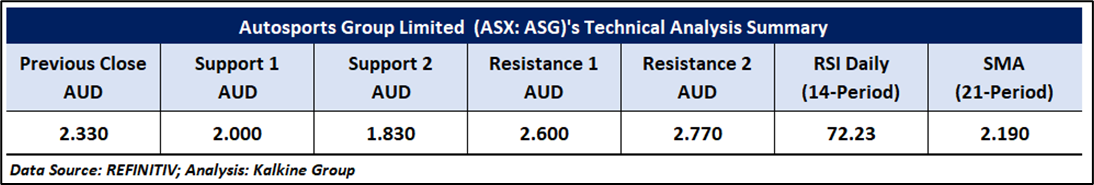
As seen from the chart below, despite being in a short-term uptrend, ASG share price is forming a negative divergence relative to the RSI (14-period) on the daily chart. Furthermore, this indicator is trading in the overbought region, indicating the possibility of a minor pullback. In contrast, prices are trading above the 21-period and 50-day SMAs, which may operate as support levels for the stock. Critical support for the stock is at AU$ 1.830, while key resistance is at AU$ 2.770.
Daily Technical Chart – ASG
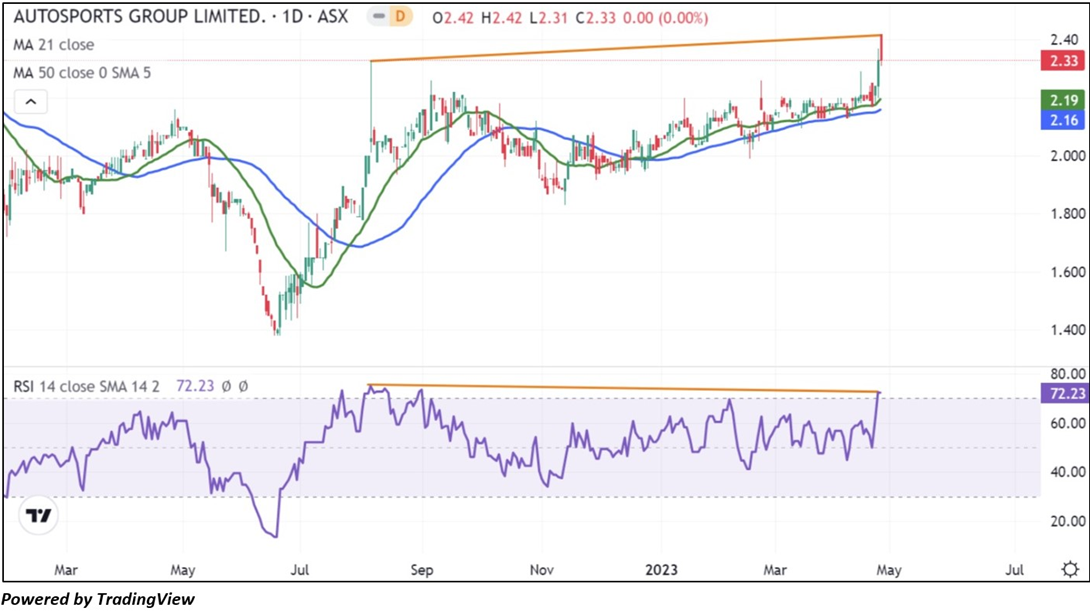
The stock was analysed as per Wednesday's (26 Apr 2023) the closing price of AU$ 2.330 per share.
Note 1: Past performance is neither an Indicator nor a guarantee of future performance
Technical Indicators Defined:
Support: A level at which the stock prices tend to find support if they are falling, and a downtrend may take a pause backed by demand or buying interest. Support 1 refers to the nearby support level for the stock, and if the price breaches the level, then Support 2 may act as the crucial support level for the stock.
Resistance: A level at which the stock prices tend to find resistance when they are rising, and an uptrend may take a pause due to profit booking or selling interest. Resistance 1 refers to the nearby resistance level for the stock and if the price surpasses the level, then Resistance 2 may act as the crucial resistance level for the stock.
Stop-loss: It is a level to protect further losses in case of unfavourable movement in the stock prices.
The Green colour line reflects the 21-period moving average. SMA helps to identify existing price trends. If the prices are trading above the 21-period, prices are currently in a bullish trend (Vice – Versa).
The Blue colour line reflects the 50-period moving average. SMA helps to identify existing price trends. If the prices are trading above the 50-period, prices are currently in a bullish trend (Vice – Versa).
The Orange/ Yellow colour line represents the Trendline.
The Purple colour line in the chart’s lower segment reflects the Relative Strength Index (14-Period), which indicates price momentum and signals momentum in trend. A reading of 70 or above suggests overbought status, while a reading of 30 or below suggests an oversold status.
Disclaimer
This article has been prepared by Kalkine Media, echoed on the website kalkinemedia.com/au and associated pages, based on the information obtained and collated from the subscription reports prepared by Kalkine Pty. Ltd. [ABN 34 154 808 312; AFSL no. 425376] on Kalkine.com.au (and associated pages). The principal purpose of the content is to provide factual information only for educational purposes. None of the content in this article, including any news, quotes, information, data, text, reports, ratings, opinions, images, photos, graphics, graphs, charts, animations, and video is or is intended to be, advisory in nature. The content does not contain or imply any recommendation or opinion intended to influence your financial decisions, including but not limited to, in respect of any particular security, transaction, or investment strategy, and must not be relied upon by you as such. The content is provided without any express or implied warranties of any kind. Kalkine Media, and its related bodies corporate, agents, and employees (Kalkine Group) cannot and do not warrant the accuracy, completeness, timeliness, merchantability, or fitness for a particular purpose of the content or the website, and to the extent permitted by law, Kalkine Group hereby disclaims any and all such express or implied warranties. Kalkine Group shall NOT be held liable for any investment or trading losses you may incur by using the information shared on our website.
