


Highlights
- RDY’s revenue increased by 10.2% YoY to AUD 113.8 million in FY24, driven by cloud platform upgrades, upselling, and new customer acquisitions.
- Net debt decreased by 20% YoY to AUD 25.2 million in FY24.
- In FY25, revenue growth projected in the low-to-mid double digits, with an underlying EBITDA margin of 34-35% (excluding LTIP impact).
ReadyTech Holdings Limited (ASX:RDY) is an Australian company specialising in software as a service (SaaS) solutions and caters mainly to government, justice, workforce management, employment services, and education sectors.
The long-term strategy of RDY focuses on large enterprise customers in main markets. These customers extend significant opportunities to RDY in terms of margin growth and lifetime value.
The company delivers tangible outcomes through its products and is committed to invest in development, innovation and research.
In the financial year 2024 (FY24), the company recorded 10.2% YoY increase in its revenue to AUD 113.8 million, backed by the cloud platform upgrade for AVAXA TAFE customers, upselling to current customers and customer acquisition as well.
During the reported period, underlying EBITDA increased by 11.5% YoY to AUD 38.8 million and underlying NPATA jumped 5.7% YoY to AUD 16.0 million.
Notably, in FY24, net debt decreased by 20% YoY to AUD 25.20 million.
Outlook
In FY25, revenue growth is anticipated to increase to the low-to-mid double digits, with an underlying EBITDA margin projected to reach 34-35% (excluding the impact of LTIP), driven by robust momentum in the enterprise strategy and cloud upgrades.
The medium-term goal is to achieve AUD 170 million in revenue in FY27, with a cash EBITDA margin exceeding 20%.
Share performance of RDY
RDY shares closed 0.68% lower at AUD 2.90 apiece on 6 November 2024. Over the past one year, RDY’s share price has decreased by 17.61% and in three months, it has lost nearly 9.66%.
52-week high of RDY is AUD 3.79, recorded on 20 February 2024, and 52-week low is AUD 2.72, recorded on 9 September 2024.
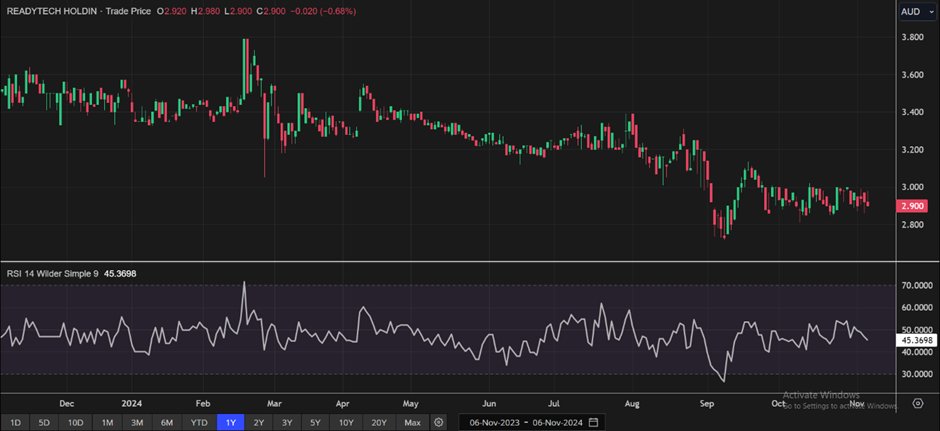
RDY Daily Technical Chart, Source: EODHD/Others
Note 1: Past performance is neither an Indicator nor a guarantee of future performance.
Note 2: The reference date for all price data, and currency, is 06 November 2024. The reference data in this report has been partly sourced from EODHD/Others.
Disclaimer
This article has been prepared by Kalkine Media, echoed on the website kalkinemedia.com/au and associated pages, based on the information obtained and collated from the subscription reports prepared by Kalkine Pty. Ltd. [ABN 34 154 808 312; AFSL no. 425376] on Kalkine.com.au (and associated pages). The principal purpose of the content is to provide factual information only for educational purposes. None of the content in this article, including any news, quotes, information, data, text, reports, ratings, opinions, images, photos, graphics, graphs, charts, animations, and video is or is intended to be, advisory in nature. The content does not contain or imply any recommendation or opinion intended to influence your financial decisions, including but not limited to, in respect of any particular security, transaction, or investment strategy, and must not be relied upon by you as such. The content is provided without any express or implied warranties of any kind. Kalkine Media, and its related bodies corporate, agents, and employees (Kalkine Group) cannot and do not warrant the accuracy, completeness, timeliness, merchantability, or fitness for a particular purpose of the content or the website, and to the extent permitted by law, Kalkine Group hereby disclaims any and all such express or implied warranties. Kalkine Group shall NOT be held liable for any investment or trading losses you may incur by using the information shared on our website.
