


Highlights
- ACL forecasts FY26 revenue of AUD 760–780 million and EBIT of AUD 67–73 million, supported by strategic investments.
- AI automation, non-MBS pricing, and lab modernisation are expected to add at least AUD 8 million EBIT in FY27.
- Total shareholder returns for FY25 amounted to AUD 44.0 million through dividends and buybacks.
Australian Clinical Labs Limited (ASX:ACL), a private pathology services provider in Australia, conducts a wide range of tests for doctors, hospitals, patients, and corporate clients. The company operates NATA-accredited laboratories that provide a broad range of testing services for hospitals, doctors, patients, and corporate clients.
In the financial year ending 30 June 2025 (FY25), the company reported total revenue of AUD 741.3 million, up 6.4% YoY from AUD 696.4 million in FY24. Statutory EBIT rose 25% YoY to AUD 66.1 million, while underlying NPAT increased 35.4% YoY to AUD 32.8 million. Revenue growth was underpinned by higher Medicare Benefits Schedule (MBS) outlays and specialist testing, while underlying EBIT benefited from operating efficiencies and margin expansion.
ACL also declared a final fully franked dividend of 9.0 cents per share, bringing the total FY25 dividend to 12.5 cps, inclusive of the interim dividend. Together with share buybacks, total capital returned to shareholders reached AUD 44.0 million during the year.
Financial Highlights
The company achieved notable financial and operational milestones:
- Free cash flow increased by 30.2%, with AUD 13 million in debt repaid.
- Earnings per share (EPS) grew by 13.4% YoY.
FY26 Guidance and Strategic Focus
In FY26, ACL expects revenue in the range of AUD 760–780 million and underlying EBIT of AUD 67–73 million. This guidance reflects ongoing investments in growth initiatives while addressing the impact of MBS fee reductions.
The company intends to prioritise margin-accretive growth by securing targeted commercial contracts, driving revenue enhancements, and ensuring disciplined expansion. ACL plans to avoid low-margin volumes, instead focusing on operational efficiency across its national pathology network.
AI billing automation, non-MBS pricing, and laboratory modernisation are expected to contribute at least AUD 8 million EBIT in FY27.
Share performance of ACL
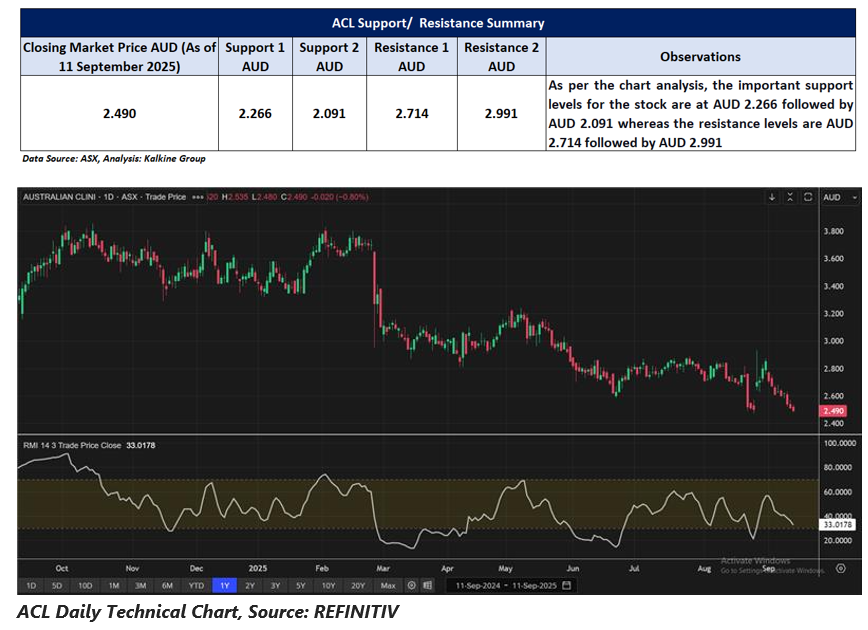
ACL shares slipped 0.80% to close at AUD 2.49 per share on 11 September 2025. In a year, the stock has declined 25.23% and is down 27.62% year-to-date. It has fallen 8.79% over the past month, 11.70% in the last three months, and 15.31% over six months. The 52-week high for ACL is AUD 3.86, recorded on 15 October 2024, while the 52-week low is AUD 2.47, reached on 25 August 2025.
Support and Resistance Summary
Note 1: Past performance is neither an Indicator nor a guarantee of future performance.
Note 2: The reference date for all price data, and currency, is 11 September 2025. The reference data in this report has been partly sourced from EODHD/Others.
Technical Indicators Defined:
Support: A level at which the stock prices tend to find support if they are falling, and a downtrend may take a pause backed by demand or buying interest. Support 1 refers to the nearby support level for the stock and if the price breaches the level, then Support 2 may act as the crucial support level for the stock.
Resistance: A level at which the stock prices tend to find resistance when they are rising, and an uptrend may take a pause due to profit booking or selling interest. Resistance 1 refers to the nearby resistance level for the stock and if the price surpasses the level, then Resistance 2 may act as the crucial resistance level for the stock.
Disclaimer
This article has been prepared by Kalkine Media, echoed on the website kalkinemedia.com/au and associated pages, based on the information obtained and collated from the subscription reports prepared by Kalkine Pty. Ltd. [ABN 34 154 808 312; AFSL no. 425376] on Kalkine.com.au (and associated pages). The principal purpose of the content is to provide factual information only for educational purposes. None of the content in this article, including any news, quotes, information, data, text, reports, ratings, opinions, images, photos, graphics, graphs, charts, animations, and video is or is intended to be, advisory in nature. The content does not contain or imply any recommendation or opinion intended to influence your financial decisions, including but not limited to, in respect of any particular security, transaction, or investment strategy, and must not be relied upon by you as such. The content is provided without any express or implied warranties of any kind. Kalkine Media, and its related bodies corporate, agents, and employees (Kalkine Group) cannot and do not warrant the accuracy, completeness, timeliness, merchantability, or fitness for a particular purpose of the content or the website, and to the extent permitted by law, Kalkine Group hereby disclaims any and all such express or implied warranties. Kalkine Group shall NOT be held liable for any investment or trading losses you may incur by using the information shared on our website.
