


Highlights
- Amotiv’s revenue rose 2.3% YoY to AUD 503.7 million in 1HFY25, driven by Powertrain and Undercar segments.
- 1HFY25 net profit dipped 1% due to margin compression.
- The company repurchased 109,712 fully paid ordinary shares as of 24 February 2025.
Amotiv Limited (ASX:AOV), formerly known as G.U.D. Holdings Limited, offers automotive services and products that addresses the changing needs of its customers. The company delivered positive financial performance while navigating macroeconomic shifts.
Financial Performance
In its financial results for the six months ended 31 December 2024 (1HFY25), Amotiv reported a 2.3% year-on-year (YoY) revenue increase to AUD 503.7 million. This growth was fueled by performances in the Powertrain and Undercar segments (+5.8% YoY) and moderate gains in Lighting, Power, and Electrical (+3.6% YoY). However, the 4WD and Trailering segments saw a slight dip of 1.9% YoY.
Despite revenue gains, underlying net profit after tax (NPAT) from continuing operations fell by 1% YoY to AUD 58.9 million, reflecting margin pressures. Nevertheless, underlying EBITDA rose by 2.6% YoY to AUD 114.9 million.
The company also announced an on-market buyback of 109,712 fully paid ordinary shares as of 24 February 2025.
Industry Dynamics
According to the Australian Bureau of Statistics (ABS) data released on 20 February 2025, Australia’s labour market remains resilient. The economy added 44,000 jobs in January 2024, with full-time employment climbing by 54,100, although part-time roles declined by 10,100. The unemployment rate edged up by 0.1 percentage point to 4.1%, but the employment-to-population ratio hit a record 64.6% — 2.4 percentage points higher than pre-pandemic levels.
This employment strength bodes well for consumer discretionary sectors, including automotive aftermarket products, as more people in stable jobs could sustain demand.
Key Positives and Negatives
Amotiv’s financial health remains robust, with gross margins hitting 44.0% in 1HFY25, significantly outpacing the industry median of 32.1%. The current ratio also improved to 2.13x from 1.72x in 1HFY24, reflecting enhanced liquidity.
On the flip side, net margins slid to 6.6%, down from 10.4% in the prior corresponding period, while return on equity (ROE) dropped to 3.5% from 5.7%.
Outlook
The company expects group revenue and underlying EBITDA to grow in FY25 on the back of the favourable 2HFY25, bolstered by new business acquisitions, product launches, and continued strength in the wear-and-repair market. Cash conversion is projected at approximately 85%.
Top 10 shareholders of AOV
The top 10 shareholders of AOV have around 45.64% shareholding in the company. The Vanguard Group, Inc. and Magellan Financial Group Ltd. have the maximum stake in the company with a shareholding of nearly 6.08% and 5.51%, respectively.
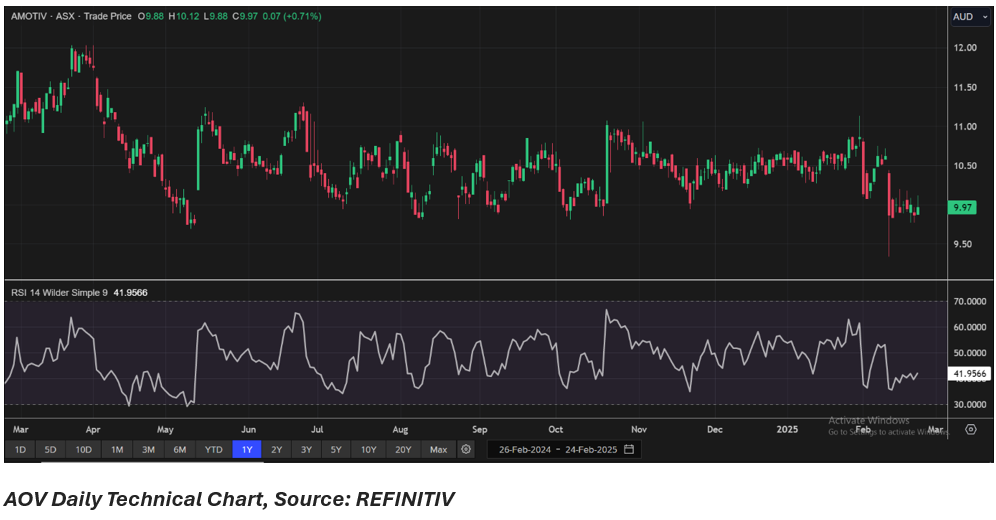
Share performance of AOV
AOV shares closed 0.71% higher at AUD 9.97 per share on 24 February 2025. Over the past year, AOV’s share price has recorded a drop of nearly 10.82% and in the last three months, it has declined by 3.20%.
52-week high of AOV is AUD 12.03, recorded on 2 April 2024 and 52-week low is AUD 9.34, recorded on 12 February 2025.
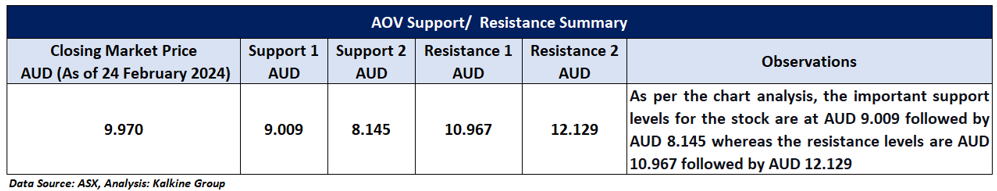
Support and Resistance Summary
Note 1: Past performance is neither an Indicator nor a guarantee of future performance.
Note 2: The reference date for all price data, and currency, is 24 February 2025. The reference data in this report has been partly sourced from EODHD/Others.
Technical Indicators Defined:
Support: A level at which the stock prices tend to find support if they are falling, and a downtrend may take a pause backed by demand or buying interest. Support 1 refers to the nearby support level for the stock and if the price breaches the level, then Support 2 may act as the crucial support level for the stock.
Resistance: A level at which the stock prices tend to find resistance when they are rising, and an uptrend may take a pause due to profit booking or selling interest. Resistance 1 refers to the nearby resistance level for the stock and if the price surpasses the level, then Resistance 2 may act as the crucial resistance level for the stock.
Disclaimer
This article has been prepared by Kalkine Media, echoed on the website kalkinemedia.com/au and associated pages, based on the information obtained and collated from the subscription reports prepared by Kalkine Pty. Ltd. [ABN 34 154 808 312; AFSL no. 425376] on Kalkine.com.au (and associated pages). The principal purpose of the content is to provide factual information only for educational purposes. None of the content in this article, including any news, quotes, information, data, text, reports, ratings, opinions, images, photos, graphics, graphs, charts, animations, and video is or is intended to be, advisory in nature. The content does not contain or imply any recommendation or opinion intended to influence your financial decisions, including but not limited to, in respect of any particular security, transaction, or investment strategy, and must not be relied upon by you as such. The content is provided without any express or implied warranties of any kind. Kalkine Media, and its related bodies corporate, agents, and employees (Kalkine Group) cannot and do not warrant the accuracy, completeness, timeliness, merchantability, or fitness for a particular purpose of the content or the website, and to the extent permitted by law, Kalkine Group hereby disclaims any and all such express or implied warranties. Kalkine Group shall NOT be held liable for any investment or trading losses you may incur by using the information shared on our website.
