


Standard deviation is a very common mathematical concept that is used to measure variance. The concept is well used in technical chart analysis also in terms of equity evaluation. Bollinger Bands® represent one such upper overlays that uses the concept of standard deviation. Bollinger Bands® inception and definition: The trading tool was developed in 1980s by John Bollinger. The trading tool is based on the concept of standard deviation and is basically a volatility indicator that evaluates and measures price volatility around a moving average to generate trading signals. Bollinger Bands® reflect a close envelope with three bands namely the upper band, the middle band and the lower band. Bollinger Bands® Calculation: The Bollinger Bands® calculation use a 20-day simple moving average (SMA). This factor is basically the middle band of the Bollinger Bands®; and the calculation for the upper band is based on 20-day SMA + 20-day standard deviation of price *2. The calculation for the lower band entails 20-day SMA - 20-day standard deviation of price *2 (2 as standard deviation multiplier). Bollinger Bands® Shape Interpretation: Price volatility is well interpreted by the shape of the Bollinger Bands®. In periods of high volatility, the shape of the band will widen and taper outside. In periods of low volatility, the band tapers inside and narrows down. Trading using Bollinger Bands®: General concept of trading using Bollinger Bands® is when candles touch the upper Bollinger Band, which is interpreted as overbought zone, price reversal is likely to occur in next trading sessions with bulls turning to bearish mode, and when candle touches the lower Bollinger Band, which is interpreted as oversold zone, and price reversal will be seen with bears turning to bullish mode. However, the interpretation cannot be fully accurate in absence of supporting indicators and price patterns. Bollinger Bands® together with candlesticks pattern formation and support of major indicators like Relative Strength Indicator gives a strong trading set up. Key Points to be considered before initiating trade set-up Using Bollinger Bands®
- Range trading: Bollinger Bands® are at times (in the event of consolidation) used as a basis for support and resistance.
- Reversals: When the prices touch the upper or the lower Bollinger Band chances of reversals might occur if not supported by major indicators.
- Breakouts: When the Bollinger Bands® become very narrow, the prices are seen to be consolidating, and volatility is very low. Narrowing of bands will happen just before a significant move in the price. Trade can happen in either direction which is technically termed as upside/downside breakout.
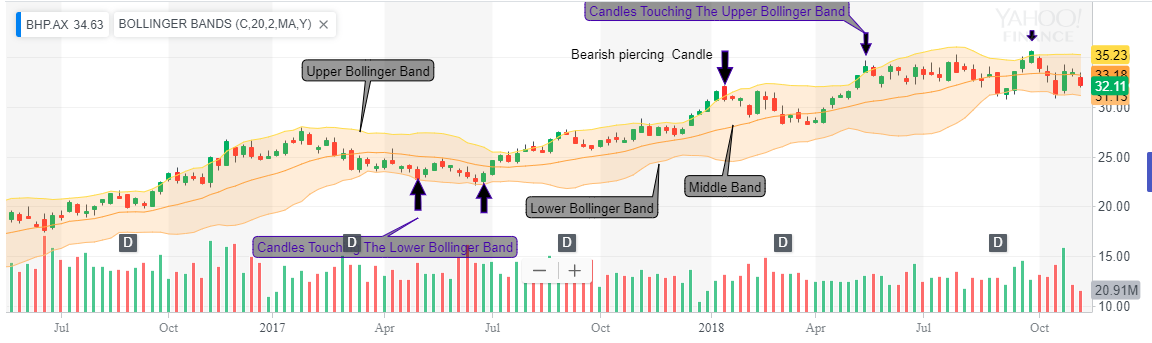 Looking at the daily chart of (ASX:BHP) and using Bollinger Bands®, trade setup is being done.
The concept works well on all time frame.
1.The Black arrows clearly give an indication regarding the upper, lower and the middle band.
Looking at the daily chart of (ASX:BHP) and using Bollinger Bands®, trade setup is being done.
The concept works well on all time frame.
1.The Black arrows clearly give an indication regarding the upper, lower and the middle band.
- Trade setup: When candles have touched the lower Bollinger Band as indicated on the charts, "Buyâ position can be initiated at this point and profits can be booked either keeping middle band as the target or the upper band as the target.
- You can book profits and exit from the trade once candle touches the middle Bollinger Band.
- You can hold the trade and wait till the candle touches the upper Bollinger Band. Once the candle touches the upper band, you can book your profits and exit the trade.
- Third option is basically to hold the trade till it reaches the middle band and book your profits partially while holding the remaining position till the time candle reaches the upper Bollinger Band and booking complete profit at that point.
Disclaimer
This website is a service of Kalkine Media Pty. Ltd. A.C.N. 629 651 672. The website has been prepared for informational purposes only and is not intended to be used as a complete source of information on any particular company. Kalkine Media does not in any way endorse or recommend individuals, products or services that may be discussed on this site. Our publications are NOT a solicitation or recommendation to buy, sell or hold. We are neither licensed nor qualified to provide investment advice.
