


WiseTech Global Limited (ASX: WTC) is an information technology company which provide software solutions for the logistic companies on a global scale. The company has a client base of more than 12,000 companies, spread across 130 countries. CargoWise One, the companyâs flagship product, executes over 54 billion data transactions annually.
On 29th May 2019, the company released a change of Directorâs interest notice. The independent Non-Executive Director of the company, Michael Gregg had disposed of some securities. The Director had sold 300,000 direct ordinary shares and 150,000 indirect ordinary shares for a consideration of $22.5 per share, and value stands at a total of $10.12 million.
Post the transaction, the director is holding 6.23 million direct ordinary shares and 7.61 million indirect ordinary shares.
Technical Outlook
Glancing at the price chart of WiseTech Global, one could easily gauge that the stock is in a bull run. The stock price has been in an uptrend making higher highs and higher lows. Currently the stock price is few cents away from its all-time high as depicted in the price chart below.
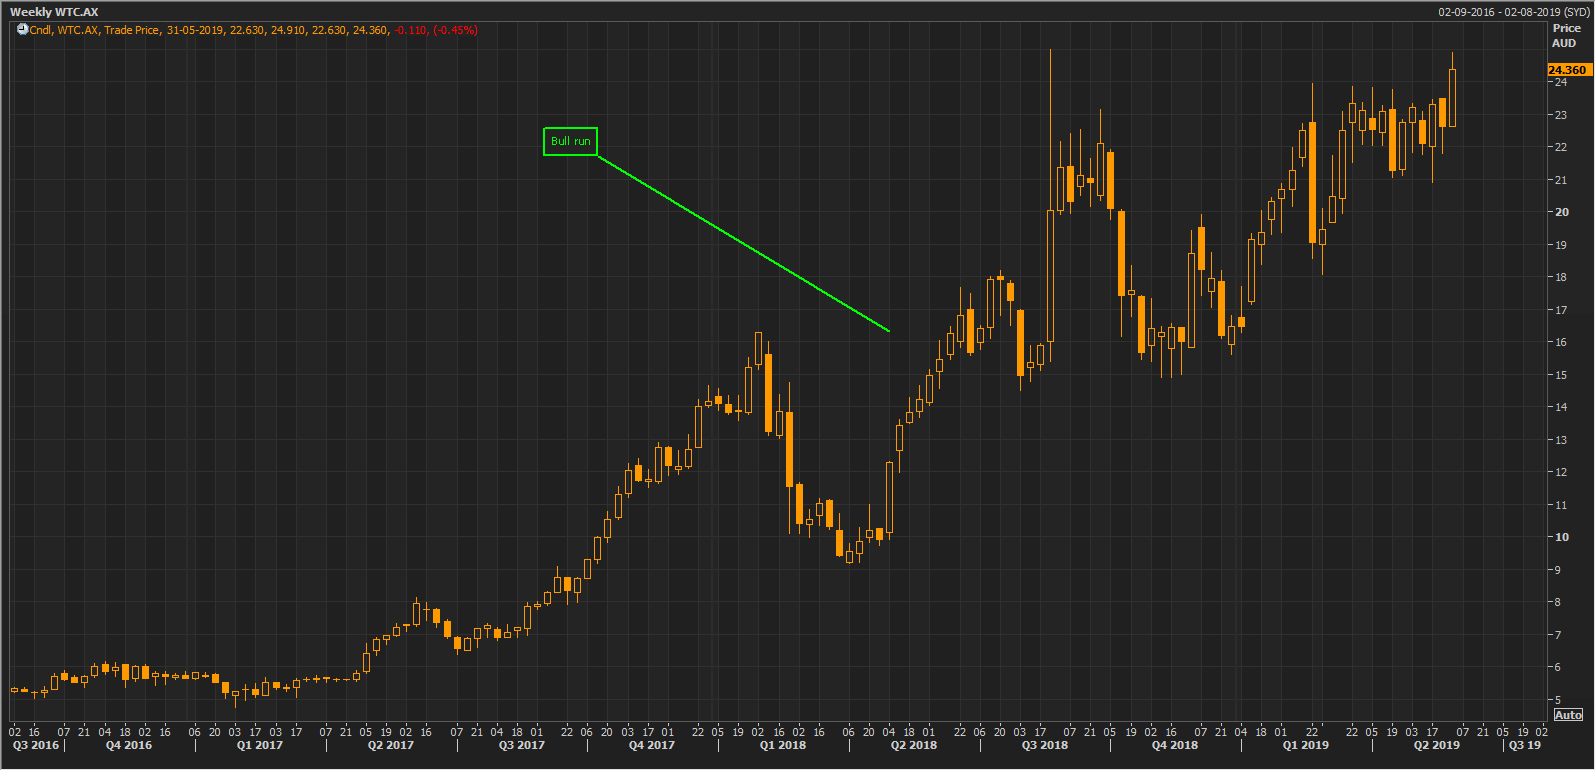 Weekly chart of WiseTech Global (Source: Thomson Reuters)
Let's analyse the trend through the lens of technical tools.
In the stock price run up to, on the weekly chart, the stock had started taking strong trendline support. The ongoing long-term bull run, is currently supported by short term trendline (support), lending encouraging signals to the traders/investors.
However, when we take a closer look through the commodity channel index (CCI), the grass gets greener on the other side.
CCI is a momentum indicator just like RSI or Stochastics, but a major point of difference is it does not include any fixed upper or lower value, in short, there is no highest or lowest value. The general rule of thumb is that values above 100 and below -100 can be used as traditional overbought and oversold zones of an oscillator. The use of oscillators for oversold and overbought conditions is discussed in many articles before, one of which can be read here.
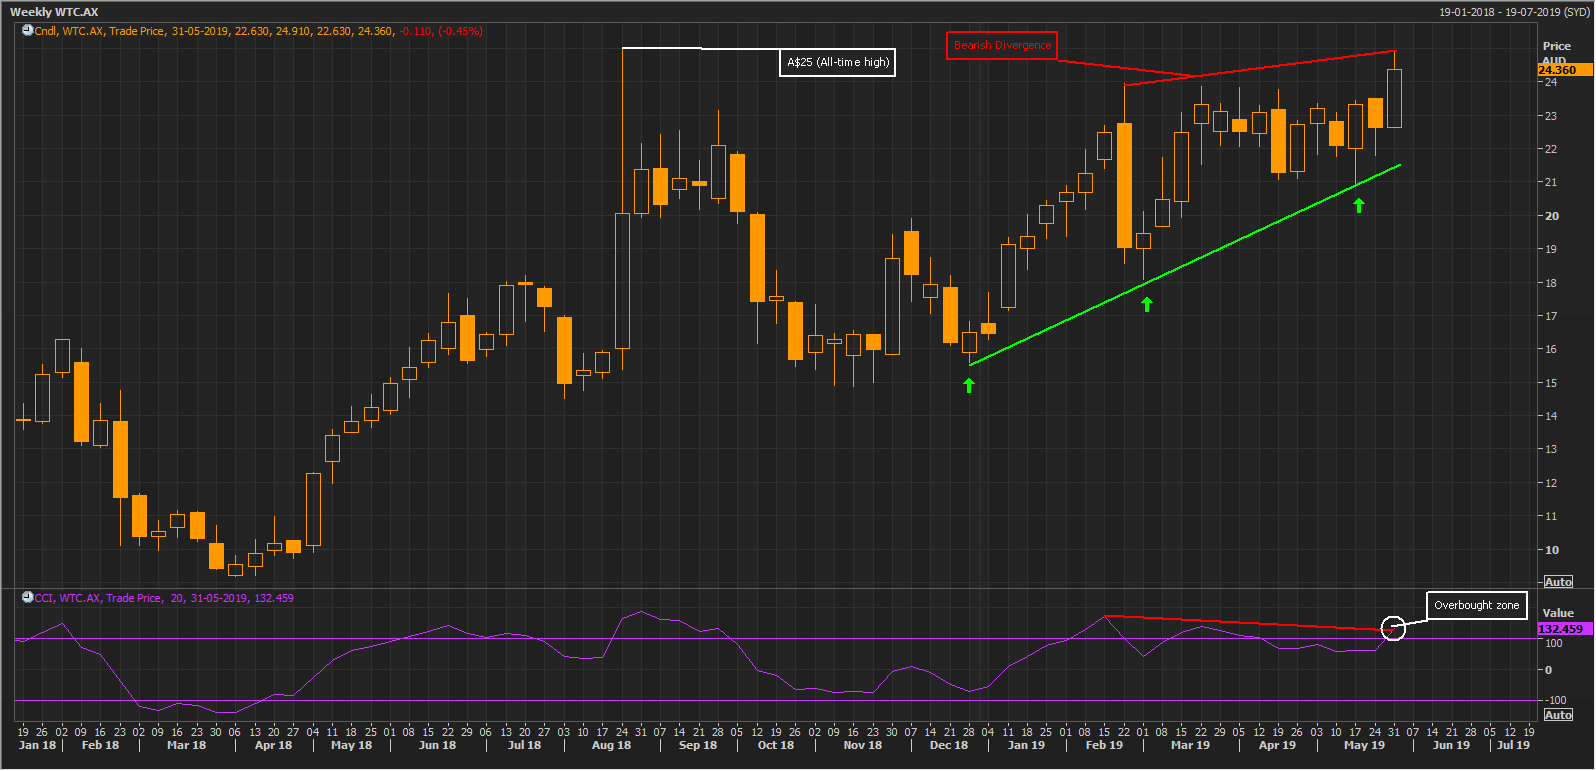 Weekly chart of WiseTech Global (Source: Thomson Reuters)
As mentioned above, taking 100 as an overbought zone makes the stock highly susceptible for further momentum. However, the value must come below 100 to depict probable selling, going by CCI.
Another reason for the worry is the bearish divergence that has started to form (marker with red lines on the chart above). Bearish divergence is explained in detail here. A bearish divergence forming at the top of any previous uptrend is effective, but when the stock is in a strong bull run, like in this case, often the divergence does not work or the correction in the price is usually minor.
Considering that the long-term bull run with trendline support getting countered with an overbought zone with a bearish divergence, and this chart dynamics unfolding near all-time high levels, draws the attention of a chartist. The professional approach under such conditions would be to wait for further confirmation signals be it a bullish signal or a bearish signal to take further actions. Hence, a wait and watch strategy could be useful.
Stock Performance
The company has a market capitalisation of A$7.76 billion, and the stock had touched a 52-week high and low of A$25 and A$14.03 respectively. The stock was down by 0.4% at A$24.36 after making an intraday low of A$24.12, as on 31st May 2019. The last one-year return of the stock is 72.9%, and the YTD return stands at 43.6%.
Disclaimer
This website is a service of Kalkine Media Pty. Ltd. A.C.N. 629 651 672. The website has been prepared for informational purposes only and is not intended to be used as a complete source of information on any particular company. Kalkine Media does not in any way endorse or recommend individuals, products or services that may be discussed on this site. Our publications are NOT a solicitation or recommendation to buy, sell or hold. We are neither licensed nor qualified to provide investment advice.
