


QBE Insurance Group Limited (ASX: QBE) is an ASX listed financial company based in Sydney, Australia and has a large foothold in the insurance market in Australia. The company is engaged in underwriting general insurance and reinsurance risks. The company works across the USA, Europe, North America, Australia etc.
On 29th May 2019, the company released a notice regarding the change of interest of substantial shareholder of the company. According to the report, the Vanguard Group, Inc. and its controlled entities have increased their stake in the company from 67.81 million shares to 80.28 million shares.
The total number of shares acquired stood at 12.47 million spread across multiple transactions. The total voting power has changed from 5.0005% to 6.059%.
Technical outlook
Since 1st March 2019, the stock has moved in a mild bullish trend. Around these levels, the Relative Strength Index (RSI) was threading the overbought zone, on the daily chart. Whenever RSI value is trading above 70, it suggests an overbought zone which implies that the price of the security has surged sharply and thus a probable selling could come about and the price may correct from the top.
This was the first warning signal as on 4th March 2019 the RSI was trading at a very high value of 85.28, which is generally rare to be seen. The stock price marked a high of A$12.79 on the same day.
The price kept on moving in a very mild uptrend for couple of weeks, making small higher highs and higher lows. As the price was inching up, the RSI failed to make new highs and was registering lower values, indicating weakness in the momentum. The time was apt to get cautious at the upper levels as RSI was trending lower and started to make bearish divergence.
A bearish divergence occurs when the security moves upwards and makes two swing tops, but the respective indicator moves in the other direction (downwards). It is to be noted that the indicator derives its values from the underlying chart price.
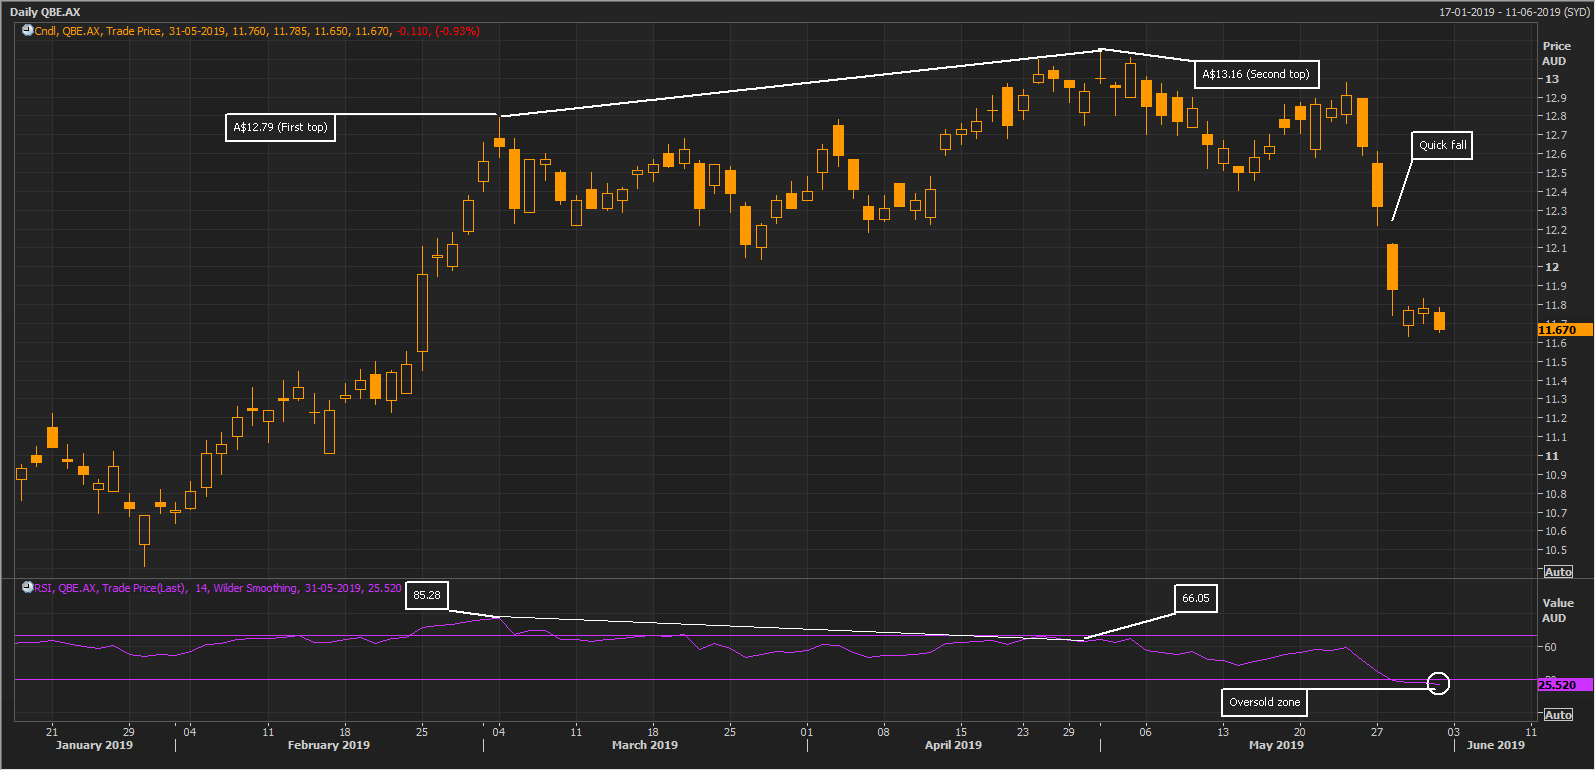 Daily chart of QBE Insurance Group (Source: Thomson Reuters)
The first top was created on 4th March 2019 at A$12.79 with the corresponding RSI value at 85.28. The next price top was made on 1st May 2019 at A$13.16, but on the same day, the RSI was trading at 66.05. Clearly, the price was able to make the new top, but the RSI failed, and this marked the initiation of a bearish divergence.
A few days later the divergence played off, and we have seen selling from upper levels, and the stock quickly fell down to the three-month low of A$11.63. Currently the RSI is in the oversold zone (value below 30), indicating a bounce from the current levels (after the RSI shows 30+ value). However, RSI hadnât moved above 30 and still in the oversold zone.
Stock Performance
The company has a market capitalisation of A$15.61 billion, and the stock had touched a 52-week high and low of A$13.16 and A$9.28 respectively. The stock closed down by 0.9% at A$11.67 after making an intraday low of A$11.65, as on 31st May 2019. The last one-year return of the stock is 23.8%, and the YTD return stands at 19.5%.
Disclaimer
This website is a service of Kalkine Media Pty. Ltd. A.C.N. 629 651 672. The website has been prepared for informational purposes only and is not intended to be used as a complete source of information on any particular company. Kalkine Media does not in any way endorse or recommend individuals, products or services that may be discussed on this site. Our publications are NOT a solicitation or recommendation to buy, sell or hold. We are neither licensed nor qualified to provide investment advice.
