


Steel Prices are recovering in the global market, and the ASX-listed steel producer with global operations- BlueScope Steel Limited (ASX: BSL) is moving closer to cross its previous 52-week high of $15.090 (high on 4 April 2019).
To know how improving steel prices and falling raw material cost is supporting the share prices of the company, Do Read: BlueScope Steel Approaches 52-Week High Despite Weaker Steel Prices and Spread in Global Markets
BlueScope Steel Limited (ASX: BSL)
BSL on Charts

BSL Daily Chart (Source: Thomson Reuters)
On the daily chart, BSL is trading above its 200-day exponential moving average as well as its 50-day exponential moving average, which are at $12.98 and $13.39, respectively. On the daily time frame, the exponential moving averages are making a Golden Crossover (a positive crossover), with the 50-day exponential moving average crossing the 200-day exponential moving average from below.
However, the volume is declining with the 14-day Relative Strength Index relatively moving to the overbought zone, which in turn, signifies that the stock might make a correction before setting up any bull-rally ahead.
If the prices correct in the market, the 50-days exponential moving average and 200-day exponential moving average could act as immediate support levels, and the investors could consider a margin of 2-3 per cent before adopting any negative stance, even if the prices breach below the 200-day exponential moving average.

BSL Daily Chart (Source: Thomson Reuters)
Post applying the Ichimoku Clouding on the daily chart, we could observe that the prices are trading well above Span A, and Span B. Span A which is currently at $13.953 is the mean value of the conversion line (pink) and the base line (navy blue), while Span B which is at $13.078 is the mean value of 52-day highs and lows.
The increasing gap between Span A and Span B is demonstrating that the stock prices are trading in an uptrend. The grey cloud, which forms when Span A goes above Span B, could act as the support if the prices take any correction.
The conversion line, which denotes that mean of 9-day highs and lows is crossing the base line, which denotes the mean of 26-day highs and lows, from below, which suggests a positive crossover and bullish movement in the share prices.
On coupling the Ichimoku with the 14-day Relative Strength Index, it could be reckoned that the prices are moving in the upside momentum; however, the RSI is entering the overbought zone with reducing spread between the base line and the conversion line, which in turn, suggests that the stock might take correction before setting out on the next leg.
While the steel giant is showing a promising rise in the share prices, the gold mining firm Northern Star Resources Limited (ASX: NST) is showing a slight upside after a deep correction over falling gold prices in the international market.
Northern Star Resources Limited (ASX: NST)
NST on Charts
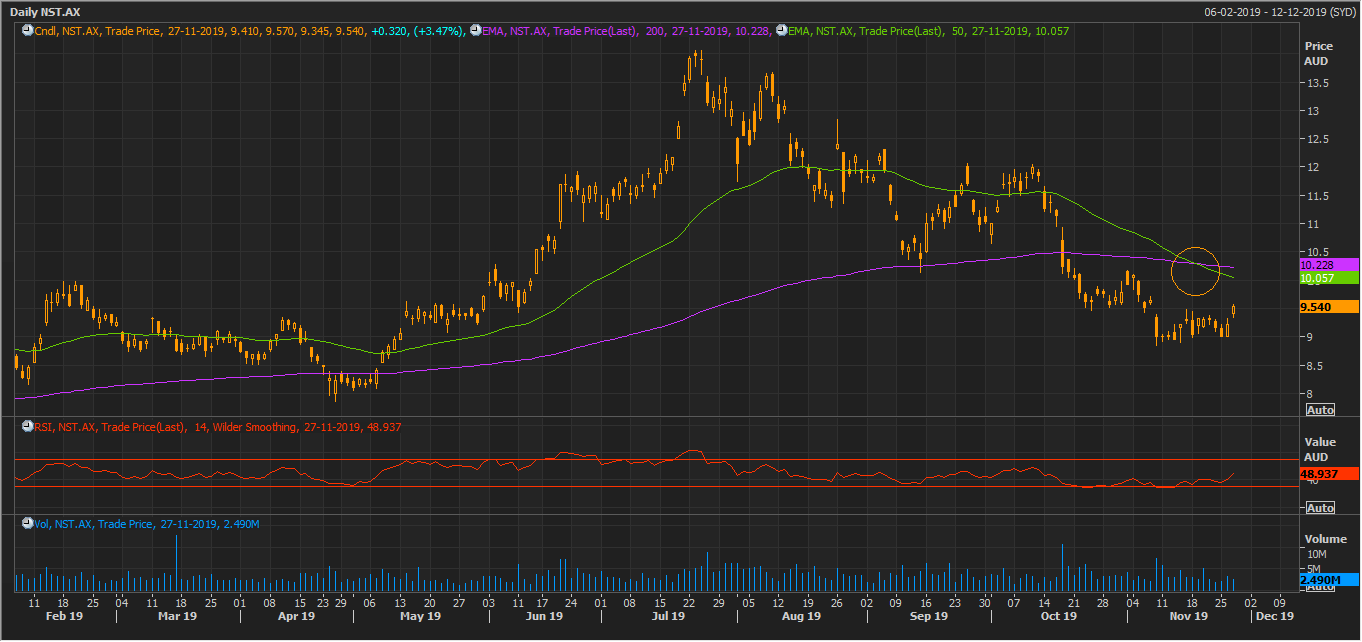
NST Daily Chart (Source: Thomson Reuters)
On the daily chart, NST is taking a slight U-turn from its recent bottom of $9.000 (low on 25 November 2019); however, the prices are currently trading below the 200-day exponential moving average and 50-day exponential moving average, which are at $10.228 and $10.057, respectively.
The pair of 200-day exponential moving average and 50-day exponential moving average is forming a Dead Crossover (a negative crossover) with 50-day exponential moving average crossing the 200-day exponential moving average from above.
However, the 14-day Relative Strength Index is moving towards the mean with a slight decline in volume, which in turn, suggests that the prices might try to cross the pair of exponential moving averages, and investors could keep an eye on that, as the pair of exponential moving averages could act as the major hurdle, and break and sustain above it or failure to do so, would decide further price action in NST.
Also, the investors should keep a breakout margin of 2-5 per cent before confirming any bullish stance.
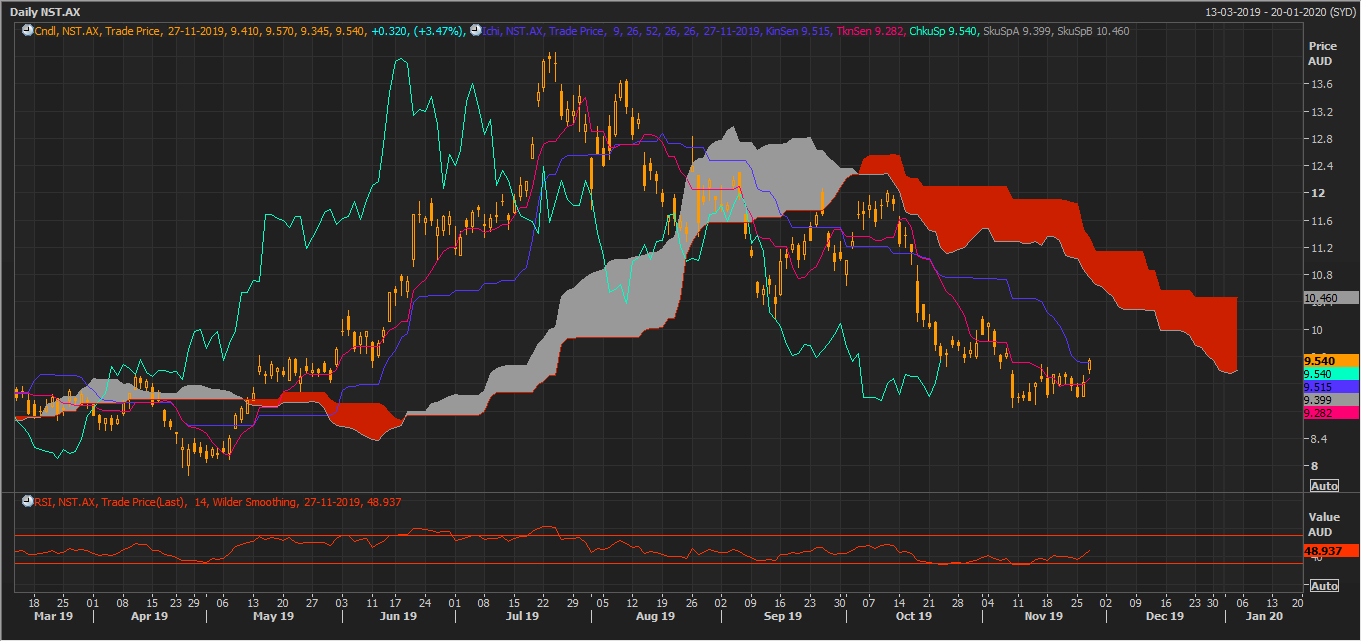
NST Daily Chart (Source: Thomson Reuters)
On applying the Ichimoku Clouding on the daily chart, we could notice, that the stock is trading below Span A, which is at $9.399, and the spread between the Span A and Span B is increasing, which further suggests that the major trends remain a downtrend. The Ichimoku moving averages, i.e., conversion line and base line, are showing a negative crossover with conversion line crossing the base line from above and below the Span A.
In the status quo, if the prices rise, the stock could face the hurdle of the red cloud, and, a break above and sustain or failure to do so would decide further price action in it.
In the status quo, most of the gold stocks on ASX are showing slight recovery as the gold buying across the significant global gold-backed ETFs surged recently.
To Know More, Do Read: ASX Gold Stocks and All Ordinaries Gold Index Capturing Investorsâ Eye Amid Recovery in Gold Prices
While the gold stocks are taking a turn around from their recent bottom, the bauxite and alumina producer on ASX- Alumina Limited (ASX: AWC) is retracing back after a pull-up rally in a major downtrend.
Alumina Limited (ASX: AWC)
AWC on Charts
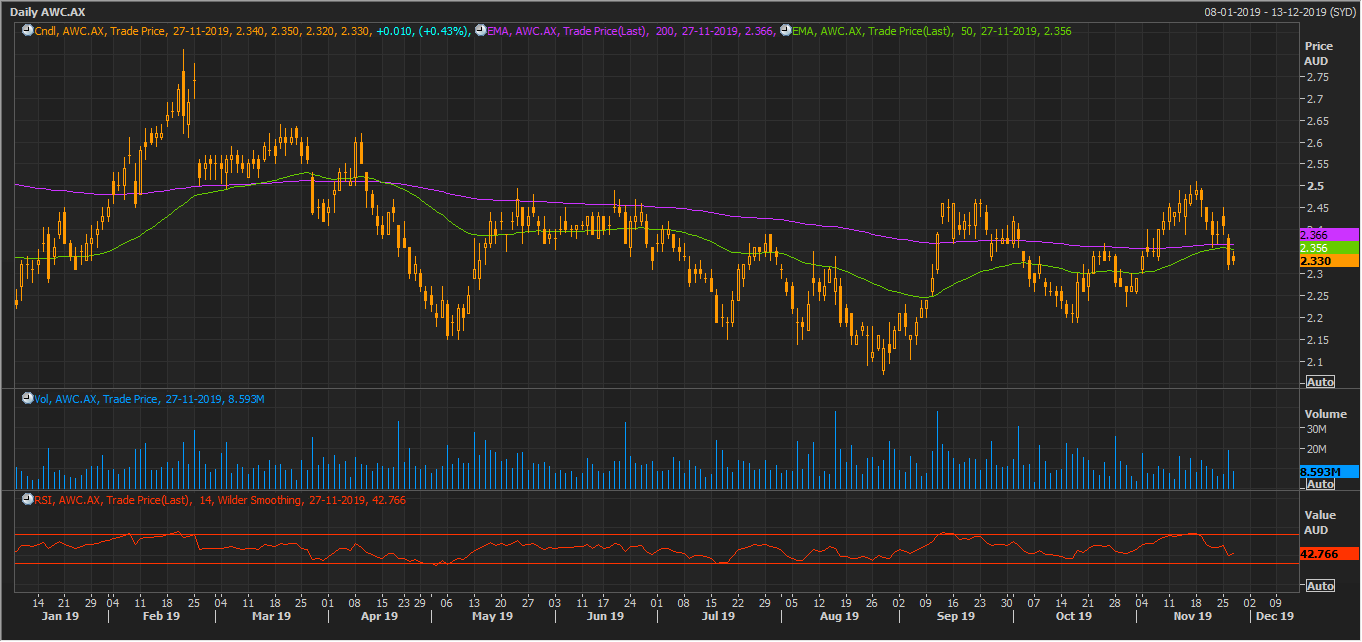
AWC Daily Chart (Source: Thomson Reuters)
On the daily chart, the stock is retracing after a pull-back rally, which started from $2.225 (low on 30 October 2019) to $2.510 (high on 18 November 2019). Presently, the stock is trading below the 50- and 200-day exponential moving averages, which are at $2.356 and $2.366, respectively.
However, the 50-day exponential moving average is below the 200-day exponential moving average, which could cross it to establish a positive crossover if the stock remains in positive territory to close above the mean of 50-day exponential moving average and 200-day exponential moving average, which is at $2.361.
The volume is declining after a recent peak on 26 November 2019, which coupled with below mean 14-day Relative Strength suggests that the exponential moving averages could provide immediate hurdle, and a break and sustain above exponential moving average or failure to do would decide further price action in it.
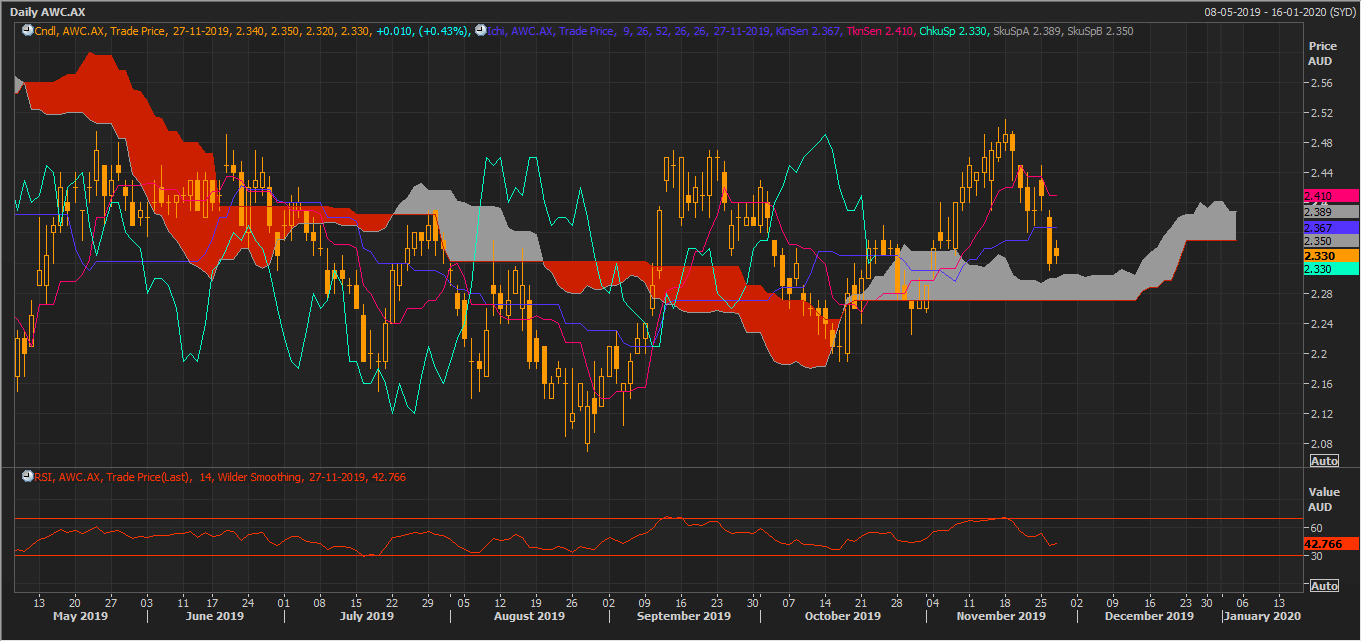
AWC Daily Chart (Source: Thomson Reuters)
On applying the Ichimoku Clouding on the daily chart, we could witness that the prices are currently trading above the support levels or the grey cloud, with a strong crossover between the conversion line and the base line.
The Ichimoku indicates that the prices could breach the hurdle of exponential moving averages, above investors could monitor each of the provided levels closely before diving into the stock.
Disclaimer
This website is a service of Kalkine Media Pty. Ltd. A.C.N. 629 651 672. The website has been prepared for informational purposes only and is not intended to be used as a complete source of information on any particular company. Kalkine Media does not in any way endorse or recommend individuals, products or services that may be discussed on this site. Our publications are NOT a solicitation or recommendation to buy, sell or hold. We are neither licensed nor qualified to provide investment advice.
