
 AUS
AUS
 NZ
NZ
 UK
UK
 CA
CA
 USA
USA
 IND
IND







Summary
- Biogen Inc.’s (Nasdaq:BIIB) net income was US$448.5 million in Q2, 2021.
- Merck & Company, Inc.’s (NYSE:MRK) market cap is US$190.1 billion.
- Johnson & Johnson’s (NYSE:JNJ) net income was US$6.2 billion in Q2 this year.
Healthcare stocks are companies that research, manufacture, and sell drugs and medical devices. Companies that run hospitals or insurance businesses also fall in this category.
The S&P 500 index follow the top 500 large-cap companies in the US. Here we explore six popular healthcare companies listed on S&P 500 index.
Biogen Inc. (Nasdaq:BIIB)
The stock of this biopharmaceutical company traded at US$337.43 at 9.41 am ET on August 10, down 0.81 percent compared to the closing price of August 9. The stock value of BBIB went up by 38.94 percent YTD.

Source: Pixabay.
The company develops therapies against neurological and autoimmune diseases. Its total revenue for Q2, 2021, was US$2.7 billion; it was US$3.6 billion in Q2, 2020. The net income for the second quarter of this year was US$448.5 million against US$1.5 billion in Q2 of the last year.
The market capital of the pharmaceutical giant is US$50.7 billion, the P/E ratio is 27.3, and the forward P/E one year is 18.23. The EPS is US$12.46.
The highest and lowest stock value of BIIB for the last 52 weeks was US$468.55 and US$223.25. The share volume is 1,047,022.
Also read: Why are these four pharma stocks drawing investors’ attention?
Abbot Laboratories (NYSE:ABT)
The stock of this medical devices company traded at US$123.11 at 10.05 am ET on August 10, down 0.02 percent compared to the closing price of August 9. The stock value of ABT surged by 12.58 percent YTD.
The total revenue of the medical distribution company for Q2 this year was US$10.2 billion against US$7.3 billion of Q2 last year. The net income in the quarter was US$1.1 billion against US$537 million in Q2 last year.
The market capitalization of the healthcare giant is US$218 billion. The P/E ratio is 34.66, while the forward P/E one year is 27.86. The EPS and the annual dividend are US$3.55 and US$1.80, respectively.
The highest and lowest stock value of ABT for the last 52 weeks is US$128.54 and US$98.67. The share volume is 109,897.
Merck & Company, Inc. (NYSE:MRK)
The stock of this global healthcare company traded at US$75.22 at 10.14 am ET on August 10, down 0.09 percent compared to the closing price of August 9. The stock value of MRK went down by 3.70 percent YTD.
The market capitalization of the pharmaceutical company is US$190.1 billion. The P/E ratio is 34.29 and the forward P/E one year is 13.64. The EPS is US$2.19, while the annual dividend is US$2.60.
The highest and lowest stock value of MRK for 52 weeks is US$87.80 and US$15.32. The share volume is 762,489.
The total revenue of the company for Q2 was US$11.4 billion against US$9.3 billion in Q2 last year. The net income for the period was US$1.5 billion versus US$3 billion of Q2 last year.
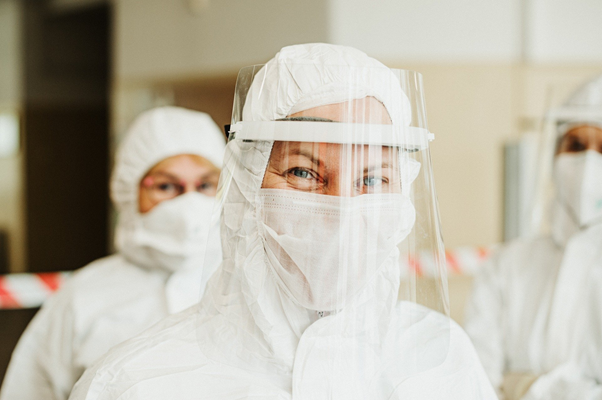
Source: Pixabay.
Johnson & Johnson (NYSE:JNJ)
The stock of this consumer and pharmaceutical company traded at US$173.56 at 10.27 am ET on August 10, down 0.12 percent compared to the closing price of August 9. The stock value of JNJ surged by 10.06 percent YTD.
The total revenue for Q2 of this year was US$23.3 and US$18.3 in Q2 last year. The net income for the quarter was US$6.2 billion against US$3.6 billion in Q2 of last year.
The market capitalization of the Covid19 vaccine maker is US$455.6 billion. The P/E ratio is 26.03 and the forward P/E one year is 18. The EPS and the annual dividend are US$6.65 and US$4.24, respectively.
The highest and lowest stock price of JNJ for 52 weeks is US$174.59 and US$133.65. The share volume is 422,116.
Moderna, Inc. (Nasdaq:MRNA)
The stock of this biotechnology and research company traded at US$460.61 at 10.43 am ET on August 10, down 4.89 percent compared to the closing price of August 9. The stock value of MRNA went up by 349.40 percent YTD.
The total revenue of the vaccine manufacturer for Q2 was US$4.3 billion against US$66.5 million of Q2 last year. The net income for the quarter was US$2.7 billion against losses of US$116.7 million in Q2 last year.
The market capitalization of MRNA is US$189.7 billion. The P/E ratio is 58.7 and the forward P/E one year is 17.14. The EPS is US$8.02. The highest and lowest stock price of this global pharmaceutical giant for 52 weeks is US$493.76 and US$54.21. The share volume is 13,009,165.
Also read: Four dividend-paying healthcare stocks to consider in Biden’s era
Universal Health Services, Inc (NYSE:UHS)
The stock of this healthcare facilities and services company traded at US$150.515 at 10.47 am ET on August 10, down 0.03 percent compared to the closing price of August 9. The stock value of UHS went up by 8.84 percent YTD.
The total revenue of the company that runs acute care hospitals, was US$3.1 in Q2 this year and US$2.7 billion in Q2 last year. The net income in Q2 was US$325 million against US$251.9 million of Q2 last year.
The market capitalization of the group that also runs outpatient facilities across the US, is US$12.7 billion. The P/E ratio is 11.84, while the forward P/E one year is 12.37. The EPS and the annual dividend are US$12.64 and US$0.80, respectively.
The highest and lowest stock price of the healthcare giant for 52 weeks is US$165 and US$99.47. The share volume is 42,465.
