.jpg)


Major U.S. stock market benchmark indexes closed lower on Friday, April 30, as shares in the energy and technology sectors were on downward trajectory. Stocks of technology giants including Amazon, Apple, Alphabet and Facebook were in the red.
The S&P 500 index declined 0.72 percent to 4,181.17 on Friday. The Dow Jones Industrial Average was down 0.54 percent to 33,874.85. The NASDAQ Composite Index fell 0.85 percent to 13,962.68 and small-cap Russell 2000 dropped 1.26 percent to 2,266.45.
However, S&P 500 grew 5.2 percent in April while Dow Jones and NASDAQ Composite gained 2.7 percent and 5.4 percent respectively during the month.
After the market close on Thursday, Amazon.com, Inc. (NASDAQ: AMZN) reported its first-quarter net income, which more than tripled from the year-ago period. Amazon saw strong growth in e-commerce and cloud revenues during the quarter.
Twitter Inc.’s (NYSE:TWTR) shares fell over 15 percent on Friday as the company projects its second-quarter revenues in the range of US$980 million and US$1.08 billion in the second quarter after reporting a 28 percent growth in its first revenues to US$1.04 billion.
Shares of oil and gas majors Exxon Mobil Corporation (NYSE:XOM) and Chevron Corporation (NYSE:CVX) also declined on the day. The companies reported profit in their first quarter of 2021 after recording loss in the last few quarters.
Meanwhile, personal income in the U.S. surged 21.1 percent or US$4.21 trillion in the month of March while personal consumption expenditure increased US$616 billion or 4.1 percent, according to the latest data from the Bureau of Economic Analysis. The increase in personal income reflects the US$1,400 monthly relief payments to American households.
Around 303 companies in the S&P 500 have reportedly released their lasts quarter results and 87.1 percent of them reportedly exceeded estimates.

Top Gainers
Top performers on S&P 500 were Aon PLC (5.32%), Tesla Inc (4.79%), Fortinet Inc (4.48%) and Willis Towers Watson PLC (4.32%).
Image Sensing Systems Inc (42.05%), Motus GI Holdings Inc (27.52%), Farmmi Inc (24.58%) and Bel Fuse Inc (22.05%) were top performers on NASDAQ.
On Dow Jones, Amgen Inc (2.10%), Merck & Co Inc (1.11%), Verizon Communications Inc (0.82% ) and Walgreens Boots Alliance Inc (0.69%) gained the most.
Top Losers
Top laggards on S&P 500 were Twitter Inc (15.16%), Resmed Inc (9.59%), Dexcom Inc (8.44%) and Skyworks Solutions Inc (8.35%).
Keros Therapeutics Inc (16.13%), Casa Systems Inc (16.01%), MicroVision Inc (15.28%) and Dolphin Entertainment Inc (14.47%) were among the top losers on NASDAQ.
On Dow Jones, Chevron Corp (3.58%), Dow Inc (2.44%), Salesforce.Com Inc (1.72%) and International Business Machines Corp (1.64%) were laggards.
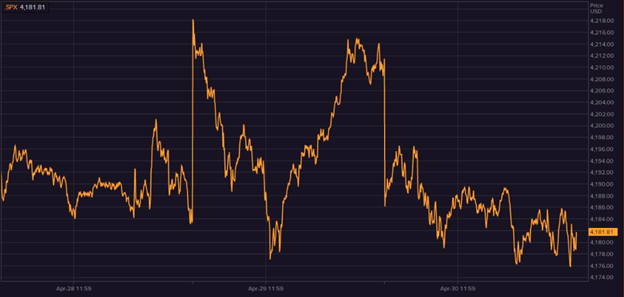
Source: EODHD/Others,S&P 500 Index five day chart
Volume Movers
Top volume movers were Naked Brand Group Ltd (47.73M), Farmmi Inc (32.82M), Apple Inc (24.34M), Ocugen Inc (19.58M), Ford Motor Co (18.49M), Vaxart Inc (15.50M), People's United Financial Inc (14.35M), Twitter Inc (14.09M), Sundial Growers Inc (12.98M), MicroVision Inc (12.57M), General Electric Co (10.83M) and Bank of America Corp (10.61M).
Futures & Commodities
Gold futures were up 0.02 percent to US$ 1,768.60 per ounce on Friday. Silver was down 0.53 percent to US$25.915 per ounce, while copper declined 0.67 percent to US$ 4.4565.
Brent oil futures dropped 2.04 percent to US$ 66.66 per barrel and WTI crude fell 2.35 percent to US$ 63.48.
Bond Market
The 30-year Treasury bond yields were down 0.51 percent on Friday to 2.298 while the 10-year bond yields were down 0.86 percent to 1.626.
US Dollar Futures Index rose 0.77 percent to US$ 91.287 on April 30.
