


Guernsey-headquartered Stobart Group Ltd is engaged in the business of biomass energy, aviation and railway maintenance services. Its areas of operations are divided into segments like Aviation, Energy, Rail & Civils, Infrastructure and investments. The group has a geographic presence in the UK, Continental Europe and Ireland. However, the majority of the group's revenue comes from the UK market.
Recently (on May 29, 2019), the group has reported its financial results for the twelve months ended February 28, 2019. In the year under review, reported revenue of the group surged by 39% to £146.9 mn against £105.4 mn reported in the last financial year.
Revenue from the Aviation business segment spiked to £39.4 mn and recorded a surge of 53% against £25.8 mn in FY18. Underlying EBITDA from the Aviation business during the trading period was bounced by 177% to £4.9 mn against the adjusted EBITDA of £1.7 mn in the last financial year. The stellar performance was driven by strong growth in the passenger numbers. Number of passengers during the reporting period surged to 1.5 mn from 1.1 mn in the previous trading period and recorded a growth of 33%.
During FY19, Stobartâs energy business segment also performed quite well during the reported trading period, with revenue recorded a growth of 19% and stood at £65.1 mn from £54.7 mn in the previous financial year. Underlying EBITDA from the energy business surged to £19.2 mn, up by 60% against the underlying EBITDA of £12.1 m reported in FY18. This performance was driven by a 51% increase in the supply to 1.3 mn tonnes as compared with 0.9 m tonnes supplied in the last financial year.
Groupâs combined underlying EBITDA from its two main operating businesses enhanced by 75% to £24.1 mn from £13.8 mn in FY18.
However, the group's underlying EBITDA reduced by 24% to £10.8 mn from £14.2 mn in the last year, primarily because of its Rail & Civil division reported an underlying EBITDA loss of £4.8 mn.
Overall groupâs bottom line loss widened by 144% to the net loss of £58.2 mn from £23.9 mn of loss recorded in the previous financial year.
Stock Performance
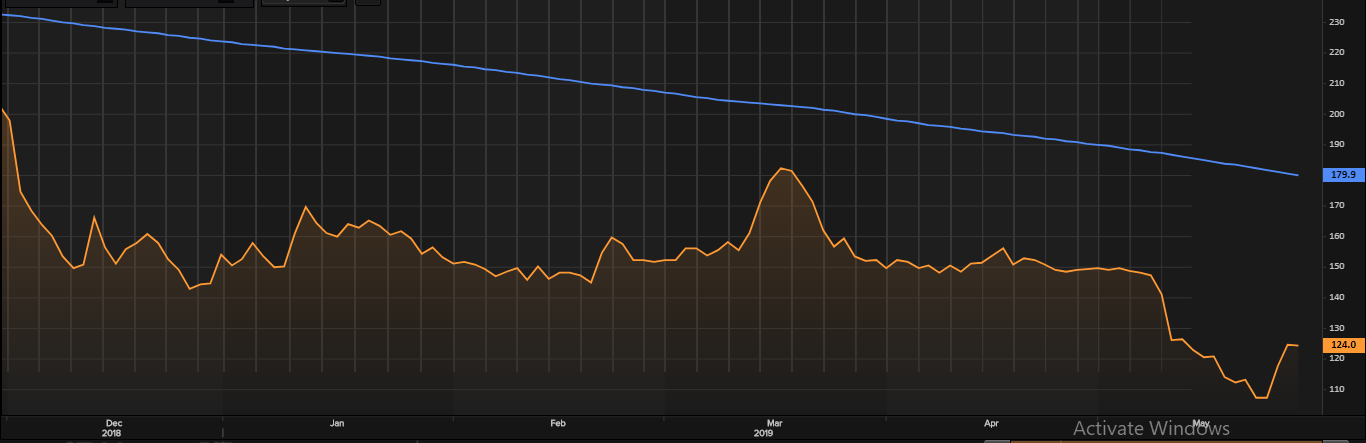
Daily Price Chart (as on May 30, 2019), before the market close. (Source: Thomson Reuters)
At the time of writing (as on May 30, 2019, at 02:32 PM GMT), shares of STOB were trading at GBX 124.0 and declined marginally against the previous day closing price. During the past year, shares have recorded a 52-wk high of GBX 272.50 and a 52-wk low of GBX 101.80. Post the group has recorded strong growth in its two main business operations, its shares have surged around 10.87% in the last five trading sessions.
However, despite a good rally in the past couple of days, it was still trading considerably below its 200-days simple moving average price, which is a crucial resistance for the stock.
The outstanding market capitalisation of the company stood at around £442.76 mn with a dividend yield of 12.06 per cent.
