


Summary
- Melrose Industries reported adjusted revenue of £4,359 million in H1 FY2020. The revenue declined by 25.80 percent year on year due to the covid-19 impact.
- The business activity improved in July 2020 and August 2020.
- Weir Group's revenue declined by 18 percent year on year to £1,095 million in H1 FY2020. The sales were impacted due to the reduced mining activity and fall in energy prices.
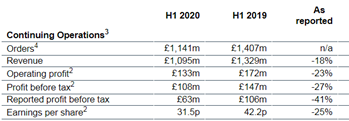
- The order book was £1,141 million in H1 FY2020, of which aftermarket and original equipment orders contributed £894 million and £247 million, respectively.
Shares of MRO and WEIR were up by approximately 61.25 percent and 110.32 percent, respectively from their 52-week low. Shares of MRO and WEIR were up by around 2.61 percent and 3.69 percent, respectively from the previous closing price (as on 4 September 2020, before the market close at 11:20 AM GMT+1).
Melrose Industries PLC (LON:MRO) - Cancelled the final dividend for FY2019
Melrose Industries PLC is a UK based Group that owns and operates industrial businesses. The Group buys manufacturing businesses, and it finances the acquisition through leverage. It improves operational and financial efficiency and then sells the business. Melrose Industries is included in the FTSE-100 index.
H1 FY2020 results (ended 30 June 2020) as reported on 3 September 2020
(Source: Group website)
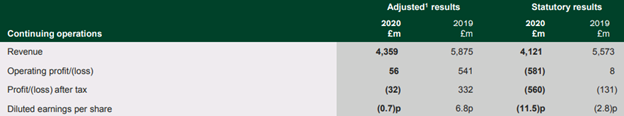
The Group reported adjusted revenue from continued operations of £4,359 million in H1 FY20, which declined by 25.80 percent year on year from £5,875 million in H1 FY19. The adjusted operating profit declined from £541 million in H1 FY19 to £56 million in H1 FY20. Melrose Industries reported a loss after tax of £32 million in H1 FY20 against profit after tax of £332 million in H1 FY19. The diluted loss per share was 0.7 pence in H1 FY20. The adjusted free cash flow was £213 million, which was due to strong cash management and working capital movement. As on 30 June 2020, Melrose Industries had net debt of £3,399 million, and it had liquidity headroom of £1,174 million. The Group would not pay the final dividend for FY19, and it did not announce the interim dividend for H1 FY20.
Performance by Segment in H1 FY2020
Aerospace segment reported revenue of £1,580 million and an operating profit of £54 million with an operating margin of 3.4 percent. The sales in the aerospace business declined, but sales to defence witnessed growth, which adds a third of the revenue to the Aerospace segment. Automotive segment revenue was £1,541 million and reported an operating loss of £64 million. Nortek Air Management segment reported revenue of £550 million and an operating profit of £71 million. Powder Metallurgy and Other Industrial reported revenue of £396 million and £292 million, respectively. The year on year growth in July 2020 and August 2020 has improved as compared to growth in H1 FY20. Nortek Air Management had a positive increase of 6 percent year on year in July 2020 and August 2020.
Share Price Performance Analysis
1-Year Chart as on September-4-2020, before the market close (Source: EODHD/Others, Thomson Reuters)
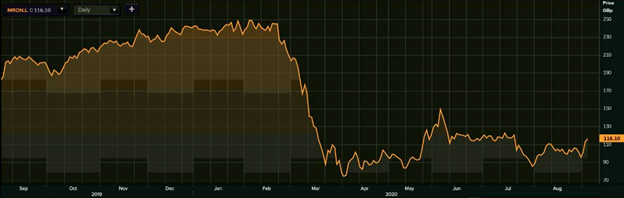
Melrose Industries PLC's shares were trading at GBX 116.10 and were up by close to 2.61 percent against the previous closing price (as on 4 September 2020, before the market close at 11:20 AM GMT+1). MRO's 52-week High and Low were GBX 309.40 and GBX 72.00, respectively. Melrose Industries had a market capitalization of around £5.50 billion.
Business Outlook
The Group witnessed a slight uptick in the business activity recently. The performance in the Aerospace segment would be subdued in the short-term due to the impact of covid-19. The recovery in the Automotive and Powder Metallurgy is expected in H2 FY20 as manufacturing facilities have reopened. The business in North America and China is expected to be resilient. The demand for Noktek Air Management would be driven by a reduction in energy and water consumption in data centres. The launch of Statepoint cooling systems by Nortek Air Management is on track.
Weir Group PLC (LON:WEIR) - No interim dividend payment in H1 FY2020
Weir Group PLC is a UK based Group that provides engineering solutions. It provides mill circuit technology and services, ground engaging tools and products & service solutions to the upstream energy market. The Group categorizes the business under Mining, ESCO and Oil & Gas. Weir Group is listed on the FTSE-250 index.
H1 FY2020 results (ended 30 June 2020) as reported on 29 July 2020
(Source: Group website)
Weir Group generated revenue of £1,095 million in H1 FY20, which declined by 18 percent year on year from £1,329 million in H1 FY19. The operating profit fell by 23 percent year on year to £133 million in H1 FY20 from £172 million in H1 FY19. The profit before tax was £108 million, and earnings per share were 31.5 pence in H1 FY20. The cash from operations was £192 million in H1 FY20, and the main borrowing facilities were refinanced. As on 30 June 2020, Weir Group had net debt of £1,167 million and it would not pay the interim dividend for H1 FY20.
Performance by Business Division in H1 FY2020
Minerals segment revenue was down by 6 percent year on year in H1 FY20 to £724 million. The revenue declined due to the lower ore production worldwide in the backdrop of the pandemic. The aftermarket sales contribute close to 74 percent of the revenue in the Minerals segment. ESCO division revenue fell by 17 percent year on year to £247 million in H1 FY20. The destocking by the distributors in North America and the shutdown of the construction business in Europe and North America affected the ESCO segment revenue. Oil & Gas segment reported revenue of £185 million in H1 FY20, which declined by 46 percent year on year. The subdued oil prices and end of production deal by Saudi Arabia and Russia impacted the Oil & Gas revenue.
Order Book by end market and geography in H1 FY2020

(Source: Group website)
Weir Group had an order book of £1,141 million in H1 FY20, which was down from order book of £1,407 million in H1 FY19. Aftermarket and Original equipment orders contribute £894 million and £247 million, respectively to the order book. Based on the end market, Mining order was £690 million, Oil & Gas order was £241 million, Infrastructure and General Industrial order was £79 million and £82 million, respectively. By region, order from North America was £408 million, Europe and FSU had the order of £123 million, Australasia had the order of £166 million, order for the Middle East & Africa was £140 million, South America and the Asia Pacific had the order of £216 million and £88 million, respectively.
Share Price Performance Analysis
1-Year Chart as on September-4-2020, before the market close (Source: EODHD/Others, Thomson Reuters)
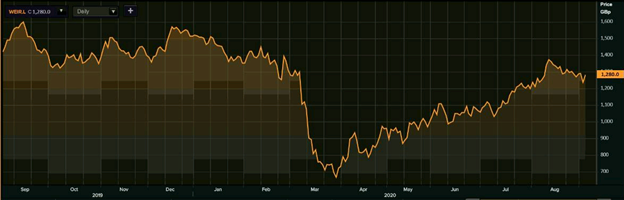
Weir Group PLC's shares were trading at GBX 1,280.00 and were up by close to 3.69 percent against the previous closing price (as on 4 September 2020, before the market close at 11:20 AM GMT+1). WEIR's 52-week High and Low were GBX 1,640.00 and GBX 608.60, respectively. Weir Group had a market capitalization of around £3.20 billion.
Business Outlook
The Group highlighted that it would do a cost-saving of £75 million in FY20 and it would reduce 830 headcounts. Weir Group has withdrawn the guidance for FY20, but it expects the operating profit headwind of approximately £7 million in FY20. The Group is confident over the long-term outlook of the mining sector; however, the recent guidance by miners for mining production is below the pre-covid level. The mining activity could be underpinned if the commodity prices are high.
