


In the yesterday market session (June 13, 2019), London Stock Exchange-listed- Ferguson Plc's shares have jumped nearly 6%, after Trian Partners, a US-based fund manager revealed that it has swelled up their holding into Ferguson to nearly 6%. Shares (LSE:FERG) ended the Thursdayâs session at GBX 5,622.0 against the previous close of GBX 5,310.0.
Ferguson Plc is a Wokingham, the UK headquartered support service provider company and specialising in the distribution of plumbing and heating products. The group has a geographical presence in the United States, United Kingdom, Canada and Central Europe. However, the United States is the most significant contributor in the group's total revenue.
In the press release revealed by the Trian Partners as on June 13, 2019, the board of the Trian 1 Ltd stated that assets managed by Trian Fund Management L.P, Trian Investors Management LLC (including assets managed by Trian in which the group is the major investor), have acquired in total 5.98% stake in the UK headquartered Ferguson Plc. Their total investment in the Ferguson valued at approximately £736 mn or US$935 mn.
Its board also revealed that; it had previously provided its nod on the Trianâs recommendation for the potential fund allocation in the Ferguson. As on June 12, 2019, the fund manager invested around £250 mn in Ferguson at a price per share of £52.85.
In the press release, the asset manager also stated that they believe that Ferguson is a lucrative investment that is available at a discount against its United States peer group. However, they also mentioned that they could adjust their stake in the company from time to time in the coming years based on the future prospects of the group and macro conditions.
As on June 10, 2019, the US based fund manger has acquired in total a 5.14% stake in the Ferguson Plc.
Post the announcement made by the Train Partnership regarding their increased stake in the company, shares of Ferguson Plc surged around 5.88% in the Thursdayâs session against the previous closing price of GBX 5,310.0 (as on June 12, 2019) and with the traded volume of 975.13k. During the Thursdayâ session, shares of Ferguson Plc touched a day high of GBX 5,876 and a day low of GBX 5,566.02 before ending the session at GBX 5,622.0.
Fergusonâs Risks
The group is witnessing increasing competition from the entry of new companies with lower-cost transactional business models or better technologies which have disrupted the industry. The company also faces risk from market cycles and macroeconomic conditions, though the group has maintained strong financials to manage the risks. Although the impending Brexit decision is not expected to cause any material impact on the company's financials, the uncertainty can impact the overall domestic market. The company's profit margins can be affected by changes in the cost of commodities or goods purchased or consolidation of suppliers. The growth in the US has continued to grow well and was widespread in the last quarter. Moreover, the current indicators augur well for its performance. Canada also reported strong results, though growth in the UK was only modest.
Trading Highlights
As on June 10, 2019, the group reported its trading update for the quarter ended April 30, 2019, revenue during the quarter under review surged by 6.2% to US$ 5,274 mn against US$ 4,968 mn recorded in the year-ago period. However, the group recorded a growth of 8.4% in the United States. Trading profit for the quarter ended April 30, 2019 stood at US$ 359 mn and recorded a growth of 2.3% against the corresponding quarter of the previous financial year. During the quarter, the group recorded decent gross margin and marginally higher than the previous year. Net Debt to EBITDA ratio for the three months ended April 30, 2019 stood at 0.9x.
Stock Information
At the closing (as on June 14, 2019), shares of the Ferguson Plc were quoting at GBX 5,566 and fell off 48 points or 0.79% against the yesterdayâs closing price. The group has an outstanding market capitalisation of £ 13.05 bn, which ranks it among the large-cap companies listed on the London Stock Exchange. As on Nov 23, 2010, its shares got listed to the main market of the London Stock Exchange for trading. The group is a constituent of FTSE All-Share, FTSE 100, FTSE 350 and FTSE 350 low yield.
The dividend yield of the company stood at 2.68%, which ranks it among FTSE 350 low-yield companies.
Price Chart â 1 Yr.
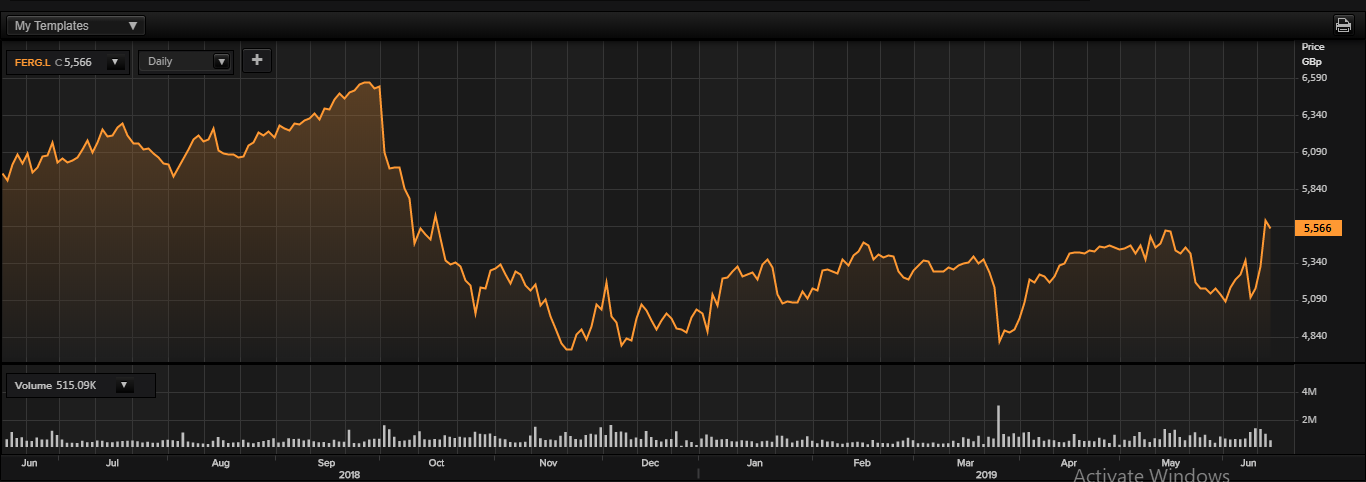
Daily price chart (as on June 14, 2019), before the market close. (Source: Thomson Reuters).
52wk High/Low range
In the past 52-wks, shares of the Ferguson Plc have registered a high of GBX 6,601.91 and a low of GBX 4,594.0, and at the current trading level, as quoted in the price chart, shares were trading around 18.6% below the 52wk high price level and 21.15% above the 52wk low price level.
Volume Summary
From the volume standpoint, its 5-day average daily volume traded stood at 1,079,299.40, which was approximately 40% above the 30-day average daily volume of 770,890.77 traded on the London Stock Exchange. This indicates that buying in the stock has substantially shot up in the last 5days as the price has also risen considerably during the same period.
Price Performance (%)
In the last one year, the share of the Ferguson Plc has delivered a price return of negative 7.0%. However, on a year-to-date basis, the stock was up by 12%, and in the last 5-days, the stock has handed a price return of approximately 7%.
In the past one year, shares ended 129 times up, 123 times down and traded flat 1 time against its respective previous closes.
Simple Moving Average (SMA)
From the SMA standpoint, shares of the Ferguson Plc were quoting above its 30-day, 60-day and 200-day SMA prices, which is a bullish technical indicator and carrying the potential to move up further from the current price level.
Relative Strength Index (RSI) The 30-day and 14-day RSI of the stock stood at 58.36 and 64.3, which indicates buying in the scrip is elevating; however, 3-day RSI of the stock stood at 85.90, which indicates it is hovering in an overbought zone and prices could correct marginally. (RSI above 70 reflects a stock has been overbought and some correction could take place).
Bollinger Bands®
At the current market price of GBX 5,578, upper Bollinger Band® stood at GBX 5,582, lower Bollinger Band® stood at GBX 4,960, and 20-day SMA stood at GBX 5,271. Therefore, this reflects that the stock is hovering near its upper band, which is a deviation of 2x from the 20-day SMA and indicates that the stock could witness some correction from the current trading level. However, if rise would continue, then the next strong resistance level is at GBX 5,740.
From the above-discussed factors, the overall mid-term trend in the stock looks decent and also the stock is trading above its 200-day SMA price, which indicates the stock is in an uptrend and could move up further from the current trading level. However, GBX 5,740 is a crucial resistance level for the stock, and GBX 5,371 is crucial support for the stock.
