


_06_19_2026_12_34_15_139937.jpg)

Summary
- Standard Chartered expects lower income in H2 FY2020 compared to H1 FY2020.
- James's Place would decide for dividend for FY2020 in February 2021 and did not announce the interim dividend payment.
- James's Place anticipates the new business value to be lower in Q3 FY2020.
Based on 1-year performance STAN was down by about 37.57 percent, whereas STJ was up by close to 5.39 percent (as on 6 August 2020 before the market close at 10:30 AM GMT+1). It should be noted that in March 2020, the Prudential Regulation Authority had suggested the large UK banks to suspend the dividend payments and share buyback until the end of 2020. Let's review the financial and operational updates to understand the stock better.
Standard Chartered PLC (LON:STAN) – No interim dividend for FY2020
Standard Chartered PLC is a UK based financial company. The Company is engaged in Corporate & Institutional Banking, Retail Banking, Commercial Banking and Private Banking. Standard Chartered is listed in the FTSE 100 index.
H1 FY20 results (ended 30 June 2020) as reported on 30 July 2020
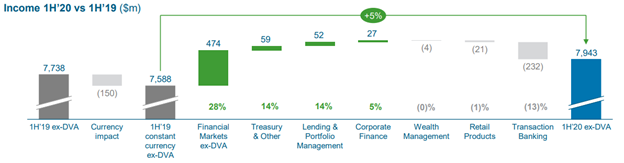
Income in H1 FY2020
(Source: Company Website)
In H1 FY20, the Company reported an income of USD 7.9 billion, which increased by 7 percent year on year on constant currency. The income in the reported period was positively supported by USD 474 million increase in financial markets excluding debit value adjustment (DVA) and increase of USD 59 million and USD 52 million from Treasury & other and lending & portfolio management, respectively. The transaction banking declined by USD 232 million in H1 FY20. Standard Chartered reported a pre-provision operating profit of USD 3.3 billion that increased by 23 percent year on year on constant currency. The Company incurred a credit impairment of USD 1.5 billion in H1 FY20 that was USD 0.2 billion in H1 FY19. The net interest margin declined to 1.40 percent in H1 FY20 from 1.66 percent in the previous year. The Company had a CET1 ratio of 14.3 percent and the liquidity coverage ratio of 149 percent. The return on tangible equity declined from 8.4 percent in H1 FY19 to 6.0 percent in H1 FY20. Based on the business division, Corporate & Institutional Banking generated an income of USD 4.0 billion, whereas Retail Banking, Commercial Banking and Private Banking reported income of USD 2.5 billion, USD 0.7 billion and USD 0.3 billion, respectively. In H1 FY20, all the business divisions grew except Commercial Banking whose income declined by 9 percent year on year following higher impairment charges and declining profit. Based on the regional performance, Greater China & North Asia generated an income of USD 3.1 billion, whereas ASEAN & South Asia, Africa & Middle East and Europe & Americas reported an income of USD 2.4 billion, USD 1.2 billion and USD 1.1 billion, respectively. The Company did not pay or announced the interim dividend for FY20.
Share Price Performance Analysis

1-Year Chart as on August-6-2020, before the market close (Source: EODHD/Others, Thomson Reuters)
Standard Chartered PLC's shares were trading at GBX 393.00 down by about 2.58 percent from the previous closing price (as on 6 August 2020 before the market close at 10:30 AM GMT+1). Stock 52-week High and Low were GBX 740.80 and GBX 368.40, respectively. The Company had a market capitalization of £12.68 billion.
Business Outlook
The Company expects the economic activity in H2 FY20 to remain volatile due to the pandemic and believes larger economies would recover sooner than the smaller ones. The income in H2 FY20 is anticipated to be lower when compared to H1 FY20 and H2 FY19. The Company stated that the expense in FY20 and FY21 would be lower than USD 10 billion. Standard Chartered expects the interest rates to remain low, and if the economic conditions do not weaken severely in H2 FY20, the impairment charges would be lower.
St. James's Place PLC (LON:STJ) - £115.7 billion of funds under management in H1 FY20
St. James's Place PLC is a UK based financial company that provides wealth management services to individuals and businesses. The Company has over 76,000 clients and 4,324 advisers. It is included in the FTSE 100 index.
H1 FY2020 results (ended 30 June 2020) as reported on 28 July 2020
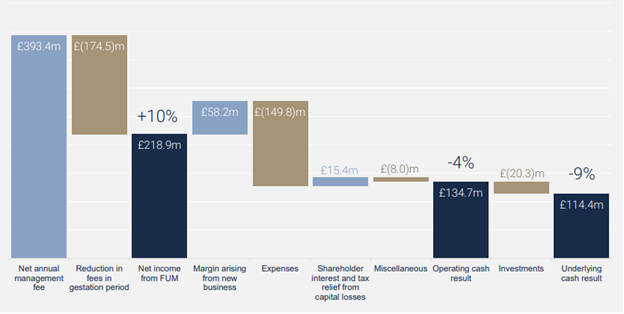
Underlying Cash Result for H1 FY2020
(Source: Company Website)
In H1 FY20, the Company had gross cash inflow of funds of £7.3 billion and a net inflow of funds of £4.5 billion that was £7.4 billion and £4.4 billion, respectively in H1 FY19. The funds under management were £115.7 billion, with 96 percent client funds retention. Investment division had £29.8 billion, whereas Pension and Unit Trust & DFM had £53.5 billion and £32.2 billion funds under management, respectively. The European Embedded Value (EEV) reported a new business profit of £365.3 million and an operating profit of £418.7 million in H1 FY20. The net income from funds under management was £218.9 million that improved from £199.8 million in the same period last year. The Company incurred the expense of £174.5 million from a reduction in fees in the gestation period in H1 FY20, which was £168.4 million in H1 FY19. The Company paid the Financial Services Compensation Scheme (FSCS) and regulatory fees of £32.3 million. St. James's Place generated profit after tax of £178.1 million that was mainly due to the positive impact of the life insurance tax. The underlying cash basic earnings per share in H1 FY20 were 21.4 pence lower than 23.7 pence in H1 FY19. The Company would decide for dividend for FY20 in February 2021; however, the Company withheld the decision to pay a final dividend of 11.22 pence for FY19. As on 30 June 2020, the solvency ratio for the Life business stood at 124 percent, and it improved from 115 percent a year ago. The Company solvency ratio was 140 percent, with liquid assets of value close to £1,108.0 million.
Share Price Performance Analysis
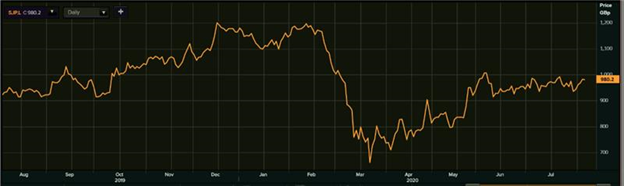
1-Year Chart as on August-6-2020, before the market close (Source: EODHD/Others, Thomson Reuters)
St. James's Place PLC's shares were trading at GBX 980.20 down by about 0.18 percent from the previous closing price (as on 6 August 2020 before the market close at 10:30 AM GMT+1). Stock 52-week High and Low were GBX 1,206.00 and GBX 614.00, respectively. The Company had a market capitalization of £5.27 billion.
Business Outlook
The Company is poised to expand the business across geographies and clients. Assessing the situation in the UK when the economy reopened in July the Company expect the bounce back in the business activity, and it is confident about delivering growth in FY20. St. James's Place highlighted that the new business value to be lower in Q3 FY20 as compared to the previous quarter and expects the business to pick up from Q4 FY20.
