


_06_19_2026_12_34_15_139937.jpg)

Summary
- Nucleus Financial Group reported assets under administration of £15.8 billion at the end of H1 FY2020. The Company had net revenue of £22.2 million in H1 FY2020.
- The Company witnessed fall in assets under administration at the end of March 2020, but some portion of it was recovered in Q2 FY2020.
- STM Group generated revenue of £11.8 million in H1 FY2020, which was underpinned by the recurring revenue.
- The earnings per share declined from 5.30 pence per share in H1 FY2019 to 1.33 pence per share in H1 FY2020.
Nucleus Financial Group PLC (LON:NUC) and STM Group PLC (LON:STM) are two FTSE AIM-listed financial stocks. Based on 1-year performance, shares of NUC and STM were down by close to 13.37 percent and 16.79 percent, respectively. Shares of NUC were down by around 0.62 percent, whereas shares of STM were up by close to 3.69 percent, from their last closing price (as on 9 September 2020, before the market close at 1:00 PM GMT+1).
Nucleus Financial Group PLC (LON:NUC) - Balance sheet remains debt-free
Nucleus Financial Group is a UK based financial company. The Company provides a wrap platform that enables advisors to combine all the client's accounts under one umbrella on the platform. The platform allows the clients to view their investments.
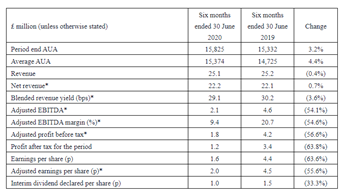
H1 FY2020 results (ended 30 June 2020) as reported on 8 September 2020
(Source: Company website)
In H1 FY20, the Company had average asset under administration (AUA) of £15.3 billion that was up by 4.4 percent year on year from AUA of £14.7 billion in H1 FY19. Nucleus Financial reported assets under administration of £15.8 billion at the end of H1 FY20, which increased by 3.2 percent year on year from £15.3 billion at the end of H1 FY19. The gross inflow was £964.2 million, and it had a net cash outflow of £749.0 million in H1 FY20. The Company reported revenue of £25.1 million in H1 FY20, which declined by 0.4 percent year on year from £25.1 million in H1 FY19. The net revenue was £22.2 million after paying the AUA related fees of £2.8 million in H1 FY20. Adjusted EBITDA fell from £4.6 million in H1 FY19 to £2.1 million in H1 FY20. Adjusted EBITDA margin was 9.4 percent in H1 FY20. The Company reported a profit after tax of £1.2 million in H1 FY20, which fell from £3.4 million a year ago. The earnings per share were 2.0 pence. Nucleus Financial declared the interim dividend of 1.0 pence per share in H1 FY20. As on 30 June 2020, the Company had cash of £18.7 million and did not have any debt on the balance sheet.
Operational Highlights
The gross inflow was strong in Q1 FY20 build on the strong momentum from Q4 FY19. The net inflow was £268.0 million in Q1 FY20, but the AUA started falling by the end of March 2020. Some of the losses were recovered in Q2 FY20. In August 2020, the Company launched a new discretionary portfolio service Nucleus IMX. The Company introduced new services to cater to the clients during the lockdown, such as accepting a scanned copy of documents and e-signatures. In H1 FY20, the customer base increased by 4.3 percent year on year to 99,797, and the active advisors increased by 3.3 percent year on year to 1,428.
Value Drivers of Nucleus Financial Group PLC
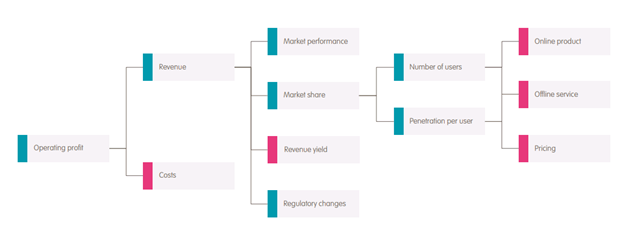
(Source: Company website)
Share Price Performance Analysis
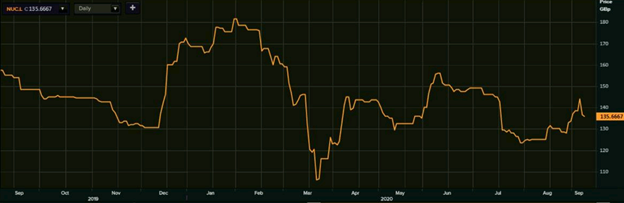
1-Year Chart as on September-9-2020, before the market close (Source: EODHD/Others, Thomson Reuters)
Nucleus Financial Group PLC's shares were trading at GBX 135.66 and were down by close to 0.62 percent against the previous closing price (as on 9 September 2020, before the market close at 1:00 PM GMT+1). NUC's 52-week High and Low were GBX 182.00 and GBX 100.00, respectively. Nucleus had a market capitalization of around £104.39 million.
Business Outlook
The Company highlights a positive sentiment over the future of its business but acknowledges the challenges business might face due to the pandemic. It has significant liquidity headroom with no debt on the balance sheet. The Company stated that it is poised to increase its market share and improve the margins.
STM Group PLC (LON:STM) - Acquired SSAS and GPP businesses
STM Group PLC is a UK based cross border financial service company. The Company provides services such as life assurance, pension, annuities and international tax. STM Group has operations in the UK, Gibraltar, Malta, Jersey and Spain.
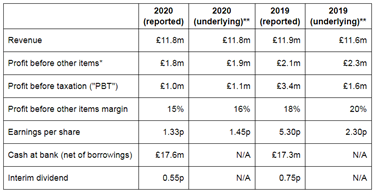
H1 FY2020 results (ended 30 June 2020) as reported on 8 September 2020
(Source: Company website)
In H1 FY20, STM Group reported revenue of £11.8 million, which was close to £11.9 million reported in H1 FY19. The recurring revenue was £10.0 million, which contributed 85 percent to the total revenue. The underlying profit before tax was £1.1 million in H1 FY20, which was lower than £1.6 million reported in H1 FY19. The underlying profit was negatively impacted due to indemnity insurance premium that was introduced in September 2019. The Company announced the interim dividend of 0.55 pence per share that would be paid in November 2020. STM Group paid the interim dividend of 0.75 pence per share in H1 FY19.
Performance by Segment in H1 FY2020
Pension segment reported revenue of £7.9 million in H1 FY20, which improved from £6.8 million reported in H1 FY19. The acquisition of Carney pension supported pension revenue. Life Assurance segment revenue declined from £2.8 million in H1 FY19 to £2.0 million in H1 FY20. Assurance segment revenue was impacted due to the release of £0.9 million of the technical reserve. Corporate and Trust Services generated revenue of £1.6 million in H1 FY20, which declined from £1.9 million reported in H1 FY19.
Acquisition of new businesses
On 13 August 2020, STM Group announced the acquisition of Small Self-Administered Schemes (SSAS) and Group Personal Pension (GPP). The two businesses are run by Berkley Burke and Berkeley Burke Employee Benefit Consultants, and STM Group wholly acquired the Company for £2.9 million. The deal would strengthen STM Group's presence in the UK. Both businesses have annualized recurring revenue of close to £1.0 million and would provide synergy with the existing operations. STM Group had received the credit facility of £5.5 million from the Royal Bank of Scotland that would be used for the transaction.
Main trading jurisdictions of STM Group
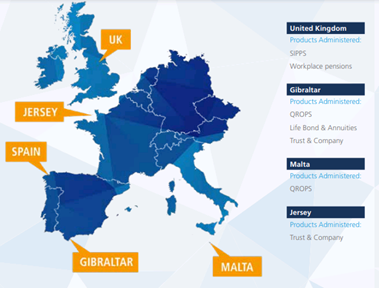
(Source: Annual report)
Share Price Performance Analysis
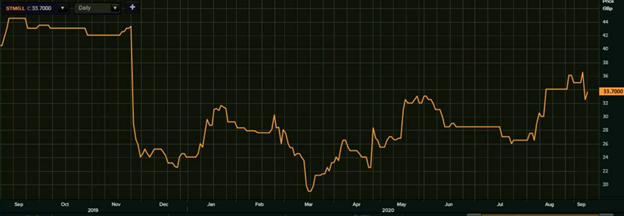
1-Year Chart as on September-9-2020, before the market close (Source: EODHD/Others, Thomson Reuters)
STM Group PLC's shares were trading at GBX 33.70 and were up by close to 3.69 percent against the previous closing price (as on 9 September 2020, before the market close at 1:00 PM GMT+1). STM's 52-week High and Low were GBX 45.00 and GBX 18.00, respectively. STM Group had a market capitalization of around £18.95 million.
Business Outlook
The Company is investing in the IT and technology infrastructure and expects the margins to improve from 2021. STM Group highlighted that the acquisition of Carney did not perform as they expected initially due to delay in transfer of schemes following the pandemic. In 2H FY20 and 2021, the Company would focus on sales and marketing of the new products launched. The Company expects that acquisition of SSAS and GPP would drive the growth in the UK.
