


Summary
- HSBC Holding's Global banking and Markets revenue grew in H1 FY2020 by 8 percent year on year.
- HSBC Holding could incur economic credit losses in the range of USD 8 billion to USD 13 billion for FY2020.
- Barclays provided financial support of approximately £22 billion to UK based businesses hit by the pandemic.
- Barclays highlighted that the impairment charges in H2 FY2020 could be higher than that experienced in the recent past.
HSBC Holdings PLC (LON:HSBA) & Barclays PLC (LON:BARC) are FTSE-100 listed banking stocks. HSBA had a market cap of close to £69.51 billion, and BARC had a market cap of £18.94 billion. HSBA and BARC shares were trading up by close to 6.57 percent and 50.19 percent, respectively from their 52-week low. HSBA was down by about 0.25 percent, and BARC was up by close to 0.46 percent from their previous closing price (as on 17 August 2020, before the market close at 11:55 AM GMT+1).
HSBC Holdings PLC (LON:HSBA) – Good business performance in Asia region in H1 FY2020
HSBC Holdings PLC is a UK based financial service group that operates in 64 countries. The Group categorizes the business under Wealth & Personal Banking, Commercial Banking and Global Banking & Markets. HSBC Holdings is included in the FTSE 100 index.
H1 FY2020 Result update (ended 30 June 2020) as reported on 3 August 2020
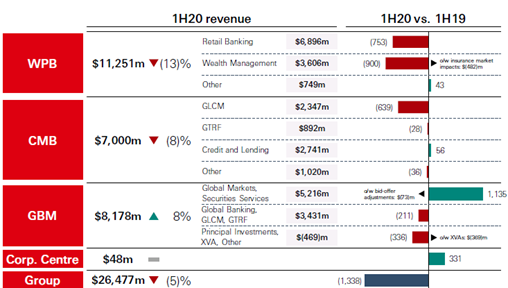
HSBC Holdings reported revenue of USD 26.7 billion in H1 FY20 that was USD 29.4 billion in the same period a year ago. The net interest income was USD 14.5 billion, whereas net fee income and net income from financial instruments held for trading were USD 5.9 billion and USD 5.7 billion, respectively. The profit before tax was USD 4.3 billion, which was down by 65.2 percent year on year. The profit after tax was USD 3.1 billion and the earnings per share were USD 0.10 in H1 FY20. The return on equity on an annualized basis declined to 2.4 percent in H1 FY20 from 10.4 percent in H1 FY19. The total expected credit losses and other credit impairment charges were USD 6.8 billion in H1 FY20 that widened significantly from USD 1.1 billion a year ago. The business performance in the H1 FY20 was dragged down by the pandemic and volatility in the market. The impairment charges increased during the reported period following charged related to some wholesale customers.
H1 FY2020 Performance by Business Activity
(Source: Group Website)
Wealth & Personal Banking revenue was USD 11.2 billion in H1 FY20 that declined by 13 percent year on year. Commercial Banking revenue was USD 7.0 billion that fell by 8 percent year on year; however, the Global Banking & Markets revenue grew by 8 percent year on year to USD 8.1 billion in H1 FY20. Based on the regional performance, Asia reported a profit before tax of USD 7.3 billion, North America and Latin America reported profit before tax of USD 0.02 billion and USD 0.01 billion, respectively. Europe and the Middle East & North Africa posted a loss before tax of USD 3.0 billion and USD 0.02 billion, respectively.
Share Price Performance Analysis
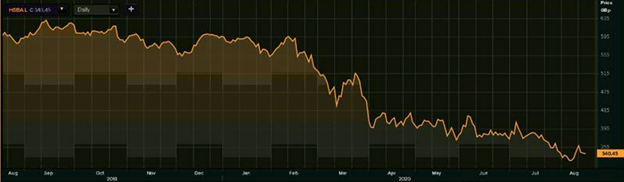
1-Year Chart as on August-17-2020, before the market close (Source: EODHD/Others, Thomson Reuters)
HSBC Holdings PLC's shares were trading at GBX 340.45 and were down by close to 0.25 percent against the previous closing price (as on 17 August 2020, before the market close at 11:55 AM GMT+1). HSBA's 52-week High and Low were GBX 633.50 and GBX 319.45, respectively. HSBC Holdings had a market capitalization of around £69.51 billion.
Business Outlook
HSBC Holdings highlighted that the current volatile market conditions would weigh down on the performance in H2 FY20 and FY21 and any development of the coronavirus vaccine could bring a turnaround. The Group has stated that it could incur economic credit losses in the range of USD 8 billion to USD 13 billion for FY20. The lower interest rates and subdued customer activity has put pressure on the revenue. The Group expects the risk-weighted asset (RWA) to grow by mid to high single-digit in FY20.
Barclays PLC (LON:BARC) – Resilient performance by Corporate & Investment bank (CIB) division
Barclays PLC is a UK based financial service group that has diversified business interest. The Group categorizes the business under Barclays UK and Barclays International. Barclays UK is a UK retail bank that offers services such as Personal Banking, Barclaycard Consumer UK and Business Banking. Barclays International is a diversified bank that provides services such as Corporate & Investment Bank and Consumer, Cards & Payments. Barclays is included in the FTSE 100.
H1 FY2020 results (ended 30 June 2020) as reported on 29 July 2020
(Source: Group Website)
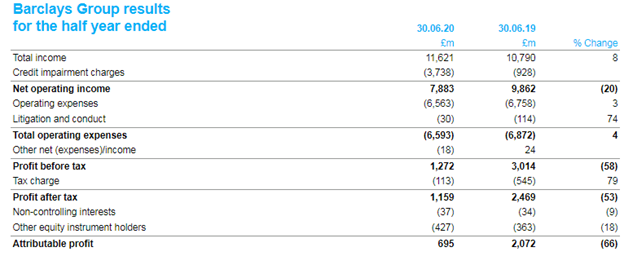
Barclays reported a net income of £11.6 billion, which increased by 8 percent year on year from £10.7 billion a year ago. Corporate & Investment bank (CIB) income increased by 31 percent year on year to £6.9 billion in H1 FY20. However, the Consumer, Cards & Payments (CC&P) declined by 21 percent year on year to £1.7 billion, and Barclays UK income fell by 11 percent year on year to £3.2 billion in H1 FY20. CC&P income was depressed due to lower consumer spending, whereas Barclays UK income was impacted following lower interest rates and waiver of fees on customers account. Barclays incurred credit impairment charges of £3.7 billion in H1 FY20, of which £0.6 billion was related to one wholesale loan charge and £2.4 billion reflected impact from changes in IFRS 9. The Group reported profit before tax of £1.3 billion and profit for the reported period was £0.7 billion. The return on tangible shareholder's equity declined to 2.9 percent in H1 FY20 from 9.1 percent in H1 FY19. The Group' liquidity coverage ratio improved to 186 percent in H1 FY20 from 160 percent in H1 FY19. The loan to deposit ratio was 76 percent as on 30 June 2020.
Support provided during the Covid-19
Barclays provided payment holidays of close to £600,000 during the pandemic, of which close to £121,000 was related to UK mortgage, close to £157,000 for UK credit cards, close to £216,000 for US credit cards and close to £106,000 for UK personal loan. Barclays provided support of approximately £22 billion to UK based businesses under bounce back loans, CBILS programmes and commercial paper issuance schemes.
Share Price Performance Analysis
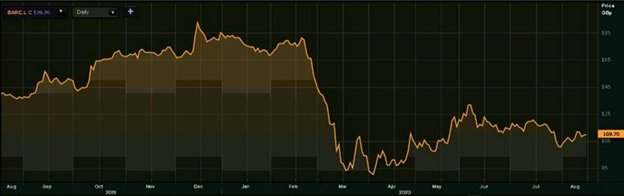
1-Year Chart as on August-17-2020, before the market close (Source: EODHD/Others, Thomson Reuters)
Barclays PLC's shares were trading at GBX 109.70 and were up by close to 0.46 percent against the previous closing price (as on 17 August 2020, before the market close at 11:55 AM GMT+1). BARC's 52-week High and Low were GBX 192.99 and GBX 73.04, respectively. Barclays had a market capitalization of around £18.94 billion.
Business Outlook
The Group highlighted that it expects the business performance of Barclays UK and CC&P to improve slightly from the Q2 FY20 level with some uptick expected in the income. The business activity in FY21 is expected to be weighed down by the low-interest rate scenario. The future performance of CIB is poised in tandem with the strong performance in H1 FY20. Barclays is mindful of the current economic scenario, and thus, it has acknowledged that impairment charges in H2 FY20 could be higher than that experienced in the recent past.
