


Charles Stanley Group PLC (CAY) is an independently owned, stockbroking and investment management group. The company offers investment services, discretionary investment management, advisory investment management, advisory dealing services, private client research, financial planning services, financial adviser and intermediary services. The company has differentiated its operations in five operating segments: Investment Management Services, Asset Management, Financial Planning, Charles Stanley Direct and Support functions. The company offers its services to private clients, charities and trusts, and institutional investors.
Financial Highlights (FY2019, £ million)

(Source: FY 2019 Results Presentation, Company Website)
The companyâs reported revenue surged by 3.2 per cent to £155.2 million as compared with the financial year 2018 data of £150.4 million, due to an increase in sales from all the divisions. Core Business profit before tax rose by 6.4 per cent to £11.6 million against the £10.9 million in 2018, while pre-tax profit margin from core business operations climbed to 9.2 per cent from 8.8 per cent in FY18. Reported profit before tax was £11.0 million, a decrease of 3.5 per cent as compared to £11.4 million reported in FY18.
Reported basic earnings per share were up by 3 per cent to 17.74 pence as compared with the previous year data. Discretionary funds stood at £13.1 billion, an increase of 6.5 per cent against the prior year data. Total FY19 dividend per share increased by 9.4 per cent to 8.75 pence as compared with the financial year 2018 data of 8 pence. Cash position was up by 23.7 per cent to £81.2 million and regulatory capital solvency ratio surged to 214 per cent against 177 per cent in FY2018.
In order to boost profit margins, the group had planned to undertake restructuring initiatives and cut senior management roles. Total restructuring cost was estimated to be around £9.5 mn and will be incurred over a span of 2-3 years. Such restructuring initiatives will help the company to save in excess of around £4.5 mn from FY2022 onwards.
Share Price Performance
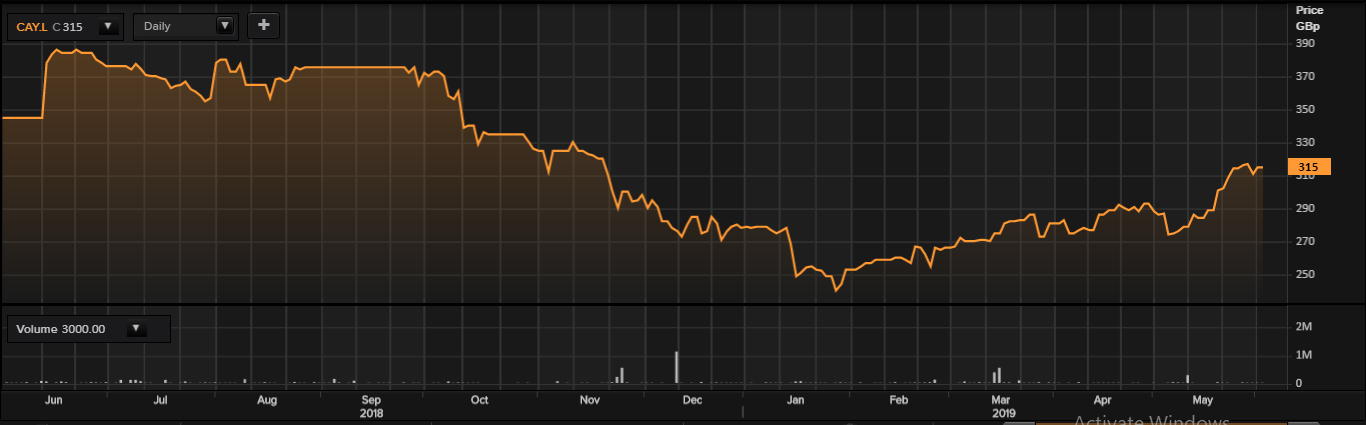
Daily Chart as at June-04-19, after the market closed (Source: Thomson Reuters)
On June 04, 2019, CAY shares closed at GBX 315 and remained flat against the previous day closing price. Stock's 52 weeks High and Low is GBX 388.40/GBX 239.60.
At the time of writing, the share was quoting 18.90 per cent lower than the 52w High and 31.47 per cent higher than the 52w low. The groupâs stock beta was 0.52, reflecting lower volatility of the stock against the benchmark index.
Stock's average traded volume for 5 days was 5,184.80; 30 days - 15,199.43 and 90 days â 22,673.06. The average traded volume for 5 days decreased by 65.89 per cent against the 30 days average traded volume. The outstanding market capitalisation was around £159.93 million with a dividend yield of 2.78%.
The company saw a sharp fall in the equities and risky assets more broadly in the last quarter of 2018. The US federal reserve also signalled that it would hold interest rates to ease the financial conditions and mitigate the possible downside risk to the economy. However, the companyâs long-term prospects are looking positive for equities. The group sees opportunities that provide a favourable backdrop for the revolution which is planned to bring an increase in revenues, profits and margins, and to provide value for shareholders.
