


Summary
- Bloomsbury Publishing reported revenue of £78.3 million in H1 FY21.
- The sales grew by 10% year on year as it was supported by online book and e-book sales.
- STV Group reported revenue of £44.7 million, which was declined by 19% year on year in H1 Y20.
- The revenue was impacted due to a fall in advertising.
Bloomsbury Publishing and STV Group are two LSE listed media stocks. The shares of BMY were up by around 0.38%, and shares of STVG were down by close to 3.43%, against the previous closing price (as on 11 November 2020, before the market close at 11:45 AM GMT)
Bloomsbury Publishing PLC (LON:BMY)
Bloomsbury Publishing is a UK based publishing house and headquartered in Bloomsbury. It publishes fiction and non-fiction books, and the publishing house has worked with authors who have won Nobel Prizes and Booker Prize. It is the publisher and custodian of the Harry Potter series. The Company has offices in London, New York, New Delhi, Oxford and Sydney.
H1 FY21 results (ended 31 August 2020) as reported on 27 October 2020
(Source: Company website)
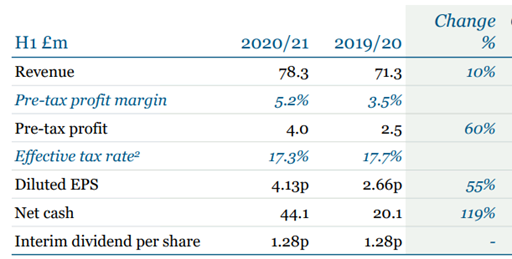
The Company had a strong performance in H1 FY21 as its revenue grew by 10% year on year to £78.3 million from £71.3 million a year ago. The growth was supported by the online book and e-book sales. The Company reported an operating profit of £3.3 million, which was much higher than £1.4 million in H1 FY20. Bloomsbury posted a net profit of £2.3 million and earnings per share were 2.89 pence in H1 FY21. As on 31 August 2020, the Company had net cash of £44.1 million, and following the strong performance, it resumed the interim dividend of 1.28 pence per share for H1 FY21.
Operational Highlights
(Source: Company website)
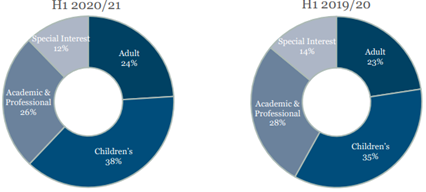
The Consumer segment generated revenue of £48.6 million, which increased by 17% year on year from ££million in H1 FY20. In the Consumer division, the Adult Trade revenue was £18.8 million and Children Trade revenue was £29.8 million. The sales of the Consumer segment were supported by sales of Sarah J Mass and Harry Potter books.
The Non-Consumer segment reported revenue of £29.7 million in H1 FY21, which was slightly lower than £29.9 million reported in H1 FY20. The Bloomsbury Digital Resources (BDR) revenue contributed £5.6 million to the sales, but the sales print sales declined during the period.
Share Price Performance Analysis of Bloomsbury Publishing PLC
(Source: EODHD/Others, chart created by Kalkine Group)
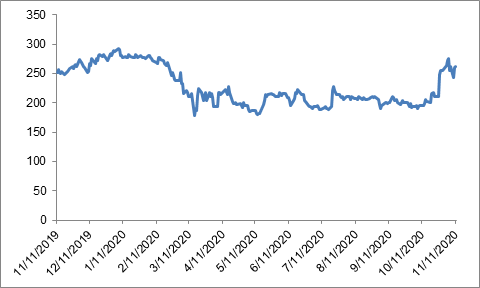
Bloomsbury Publishing PLC's shares were trading at GBX 261.00 and were up by close to 0.38% against the previous closing price (as on 11 November 2020, before the market close at 11:45 AM GMT). BMY's 52-week High and Low were GBX 294.64 and GBX 159.92, respectively. Bloomsbury Publishing had a market capitalization of around £232.18 million.
Business Outlook
The Company had a strong performance in H1 FY21, and it highlighted that it would operate effectively and look for acquisition opportunities. The operation in the first six weeks of H2 FY21 has been resilient. From the past trends, the performance of the Company is better in the second half of the financial year than the first half due to Christmas and sales of academic titles. The Company is cautious over the short-term outlook of the publishing, but the long term prospects look promising. It would invest in developing new content and it would build a healthy pipeline of authors and titles. Some of the books to be published in H2 FY21 are Quidditch Through the Ages by J.K. Rowling, Fantastic Beasts and the Wonder of Nature and Court of Thorns and Roses series.
Would STV Group be able to grow its viewer base organically?
STV Group is a Scotland based media company. It is also engaged in television broadcast, television production and video-on-demand. STV Group is included in the FTSE All-Share index.
Recent Events
- On 12 October 2020, the Company reported that it added over 250 hours of new content on STV player. The content added includes new drama, sports, crime and lifestyle programmes. The content is for Q4 20. The STV Player has seven live channels and around 1,750 hours of exclusive content. The online streaming has increased by 66% year on year and the number of minutes watched increased from 719 million to 1.32 billion, which increased by 84% year on year. In 2020, STV player has been launched on Freeview Play, Virgin Media and YouView.
- On 7 October 2020, STV Group reported that TV viewing has increased by 13% and the online viewing surged by 84% to the end of September 2020. In Scotland Broadcaster STV was best watched TV Channel throughout Q3.
H1 FY20 results (ended 30 June 2020) as reported on 1 September 2020
(Source: Company website)
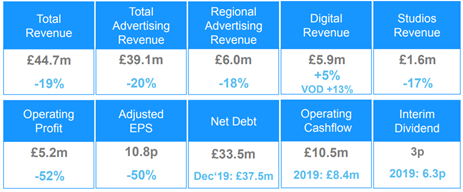
In H1 FY20, the Company reported revenue of £44.7 million, which declined by 19% year on year from £54.9 million in H1 FY19. The sales were impacted due to a fall in advertising revenue. The operating profit was £5.2 million in H1 FY20, which declined by 52% year on year from £11.0 million a year ago.
STV Group reported a loss before tax of £4.9 million against a profit before tax of £9.1 million in H1 FY19. As on 30 June 2020, STV Group had net debt of £33.5 million, and it announced a dividend of 3.0 pence per share. The proposed interim dividend for H1 FY20 would be paid through the issuance of common shares.
Operational Performance
(Source: Company website)
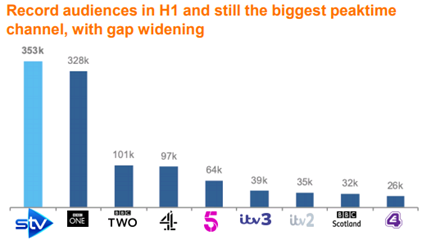
The Company saw encouraging viewing growth in TV and online platforms. The audience growth was 12%, which was the highest of all time. During the lockdown, the viewing increased by 24%, and the daytime viewing and STV news viewing grew by 48% and 40%, respectively.
Share Price Performance Analysis of STV Group PLC
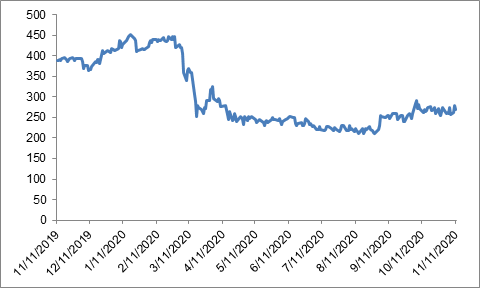
(Source: EODHD/Others, chart created by Kalkine Group)
STV Group PLC's shares were trading at GBX 270.40 and were down by close to 3.43% against the previous closing price (as on 11 November 2020, before the market close at 11:45 AM GMT). STVG's 52-week High and Low were GBX 455.00 and GBX 210.00, respectively. STV Group had a market capitalization of around £120.00 million.
Business Outlook
Amid the current uncertain condition, the Company refrained from providing any financial guidance. The Company is focused on the diversification of STV, which is its growth strategy. STV Group witnessed improved advertising revenue in July that was down by -7% and it grew by 1% in August 2020. The Company is confident over the growth of the digital business, which has shown resilience during the pandemic. The Company has secured commissions in advance in between £15 million to £20 million for 2021. The long-term fundamentals of the Company are strong.
